© Ewan Macpherson, 1998
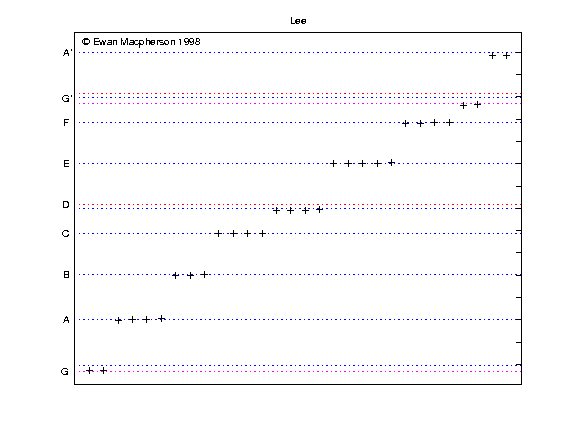
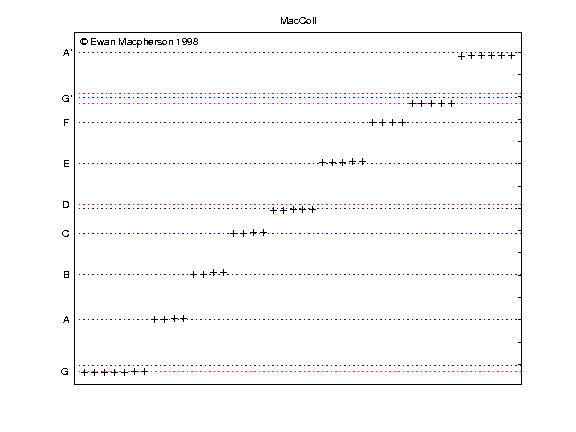
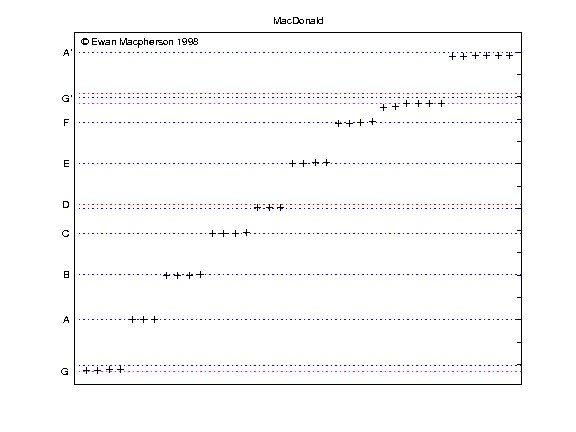
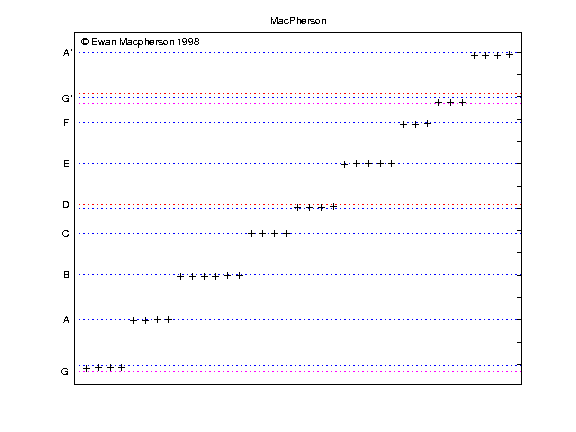
Using the Piping Centre 1996 Recital Series CDs (Temple Records) as a corpus of recent, expert performances, I measured the frequencies of each note of the chanter scale and of the drones a number of times for each player. Small snippets of each performance, each containing a single chanter note (typically 100 or 200 ms long), were analyzed. The ratio of the chanter frequency to the drone frequency was used to establish the observed frequency ratio for each note of the scale. Measurements were taken from ceol beag tracks, thus the high G's measured were not made with the piobaireachd fingering.
The graphs show all the individual measurements on a logarithmic frequency scale. The names of the chanter notes are identified at the left, while on the right, tick marks occur every 100 cents corresponding to the division of the octave into 12 equally tempered semitones.
Horizontal dashed lines indicate theoretical ratios for the various notes. Lines in blue indicate the intervals for a major scale (with minor 7th) in 5-limit Just Intonation. Lines in red show MacNeill's proposed intervals in those cases in which they deviate from Just Intonation (i.e. D and high G). Lines in purple correspond to the "Harmonic" or "septimal" (7-limit Just Intonation) tunings of low and high G.
Briefly:
These data suggest that the conventional tuning of the chanter's G's and D has changed significantly since MacNeill's measurements in the mid 1950s.


