Urban Surface Temperatures
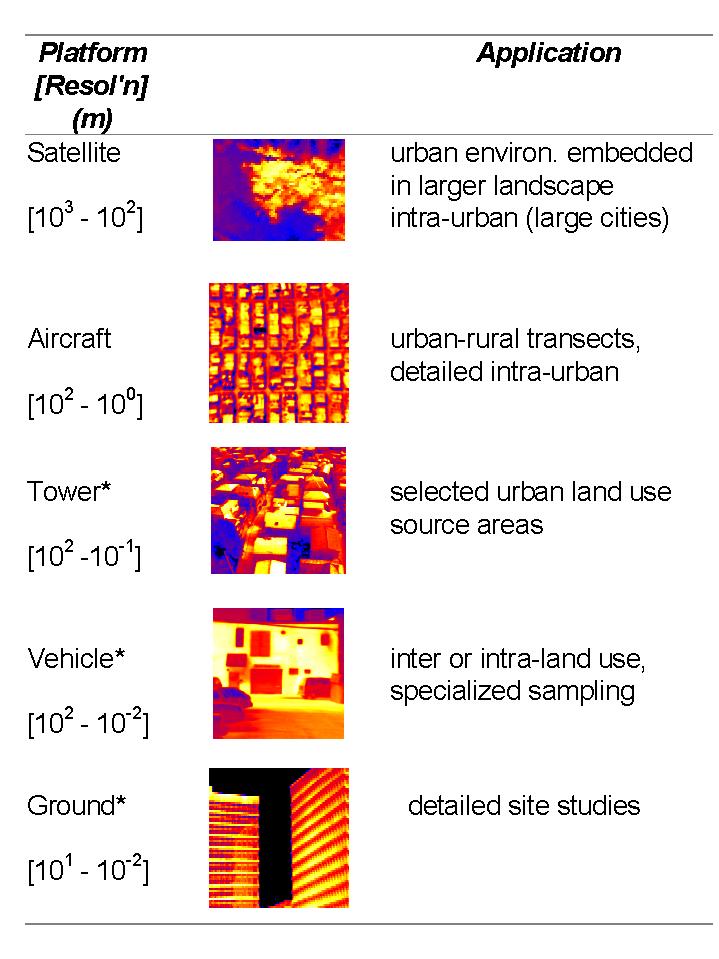
Urban surface temperatures may be observed from a range of platforms (e.g. satellites, aircraft, towers, or ground-based). Each provides a particular perspective and is useful for different applications.
The "Complete Surface Temperature" (Tc) is a temperature which takes into account all the surfaces present in an urban area. Various representations of the urban surface are possible. Figure 1 illustrates 6 possible urban surface definitions which are used by observational systems or models.
Figure 1. Urban surface definitions. From Voogt and Oke (1997).
Of the surface definitions in Figure 1, only the complete surface includes all the surface components. Estimating the temperatures of the various components can be a challenge. We have used two primary observation systems:
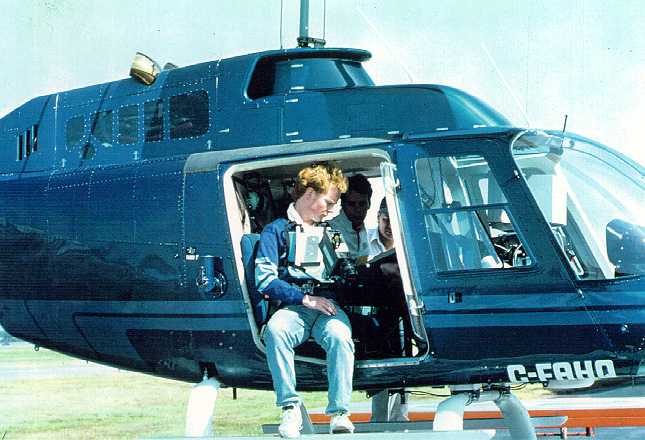
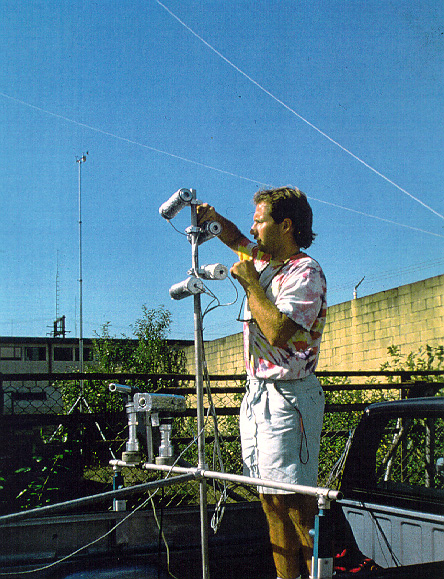
Figure 2. Left: Helicopter and thermal scanner. Right: truck-mounted infrared transducers.
Data from these two observing systems can be combined to estimate a complete surface temperature (along with a surface database which details information on building dimensions).
 Figure 3. Estimation of
Tc from combined temperature frequency
distributions. From Voogt and Oke (1997).
Figure 3. Estimation of
Tc from combined temperature frequency
distributions. From Voogt and Oke (1997).
During the day, complete surface temperatures are generally cooler than most nadir or off-nadir remote thermal measurements.
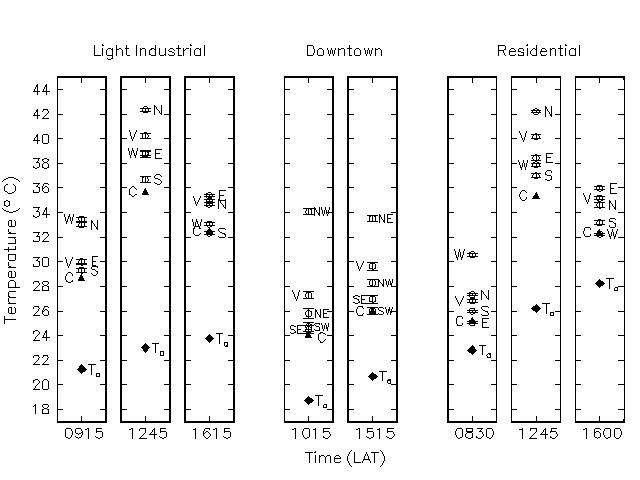
Figure 4. Left: Nadir and complete surface temperature frequency distributions for a downtown area in Vancouver BC. Right: Comparison of Tc (labelled C) with nadir (V), off-nadir (N,S,E,W directions) and air temperatures (Ta).
Image approaches (using GIS) are also available to represent temperatures of surfaces not generally seen in nadir views. The following figures illustrate the conceptual approach and an example from a simple urban area in Vancouver (Voogt 2000).
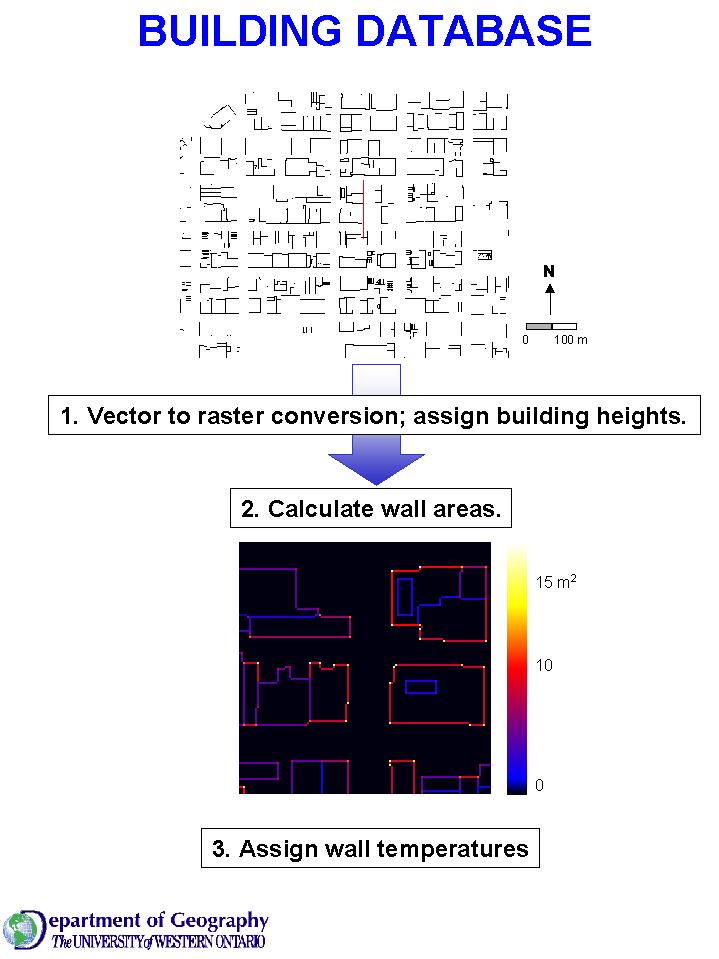
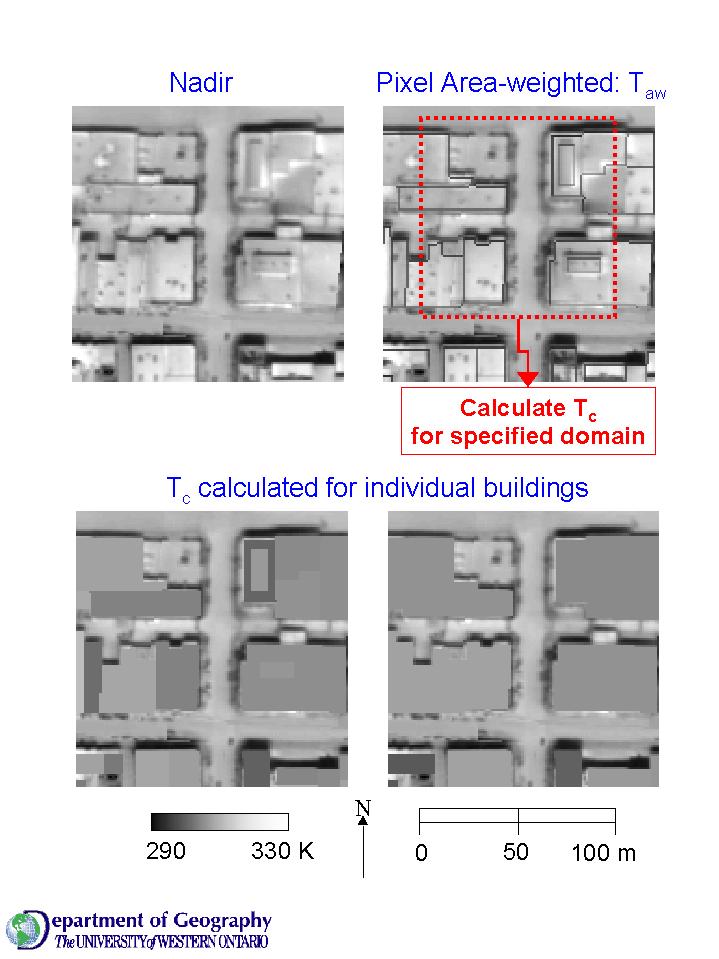
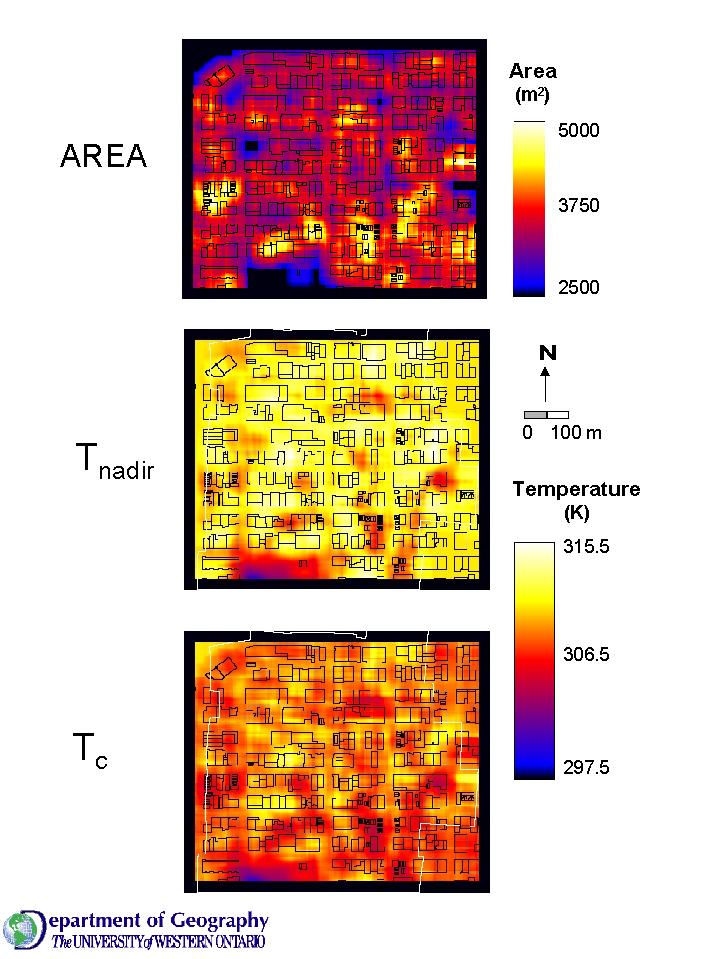
Figure 5. Calculation of
Estimating Tc is observationally and computationally expensive so we need to include work with scale and numerical models and observational techniques to find alternative methods for estimating Tc. Figure 6 illustrates the use of the image technique to provide set of points for developing relations between Tnadir and Tc.
