- probing the outermost 1-3 nm surface
- identifying organic molecules
- imaging and depth profiling
How ToF-SIMS works?
In ToF-SIMS, such as the IONTOF
 TOF-SIMS IV at Surface Science Western, a pulsed (~1 ns) primary ion beam (e.g., 25 keV Bi3+) is used to bombard the sample surface. This bombardment generates secondary particles, including ions, electrons, and neutral particles, which carry chemical information about the surface. Depending on the polarity of the electric field applied between the extractor and the sample stage, either positive or negative ions are extracted one at a time by an electric field (e.g., 2 kV). The extracted ions gain energy of 2 keV (assuming they are singly charged). These energetic ions then travel through a flight tube (2 m in length). Lighter ions fly faster and thus reach the detector before the heavier ones.The detection system consists of three sequentially connected components: (1) a microchannel plate that generates an electron cascade, (2) a scintillator that converts these electrons into photons, and (3) a photomultiplier tube that amplifies the resulting photons and converts them into electrical pulses, which represent the intensities of the detected ions.
The basic concept of ToF-SIMS is illustrated below (in the case of positive ion extraction; the polarity of the extraction electric field is reversed for negative ion extraction).

The ions arrive at the detector based on their flight times, which are determined by their mass-to-charge ratio (m/z). As illustrated in the following figure, the measured time events of the ions striking the detector are converted to m/z through calibration with known species such as hydrogen, carbon, and hydrocarbons, as well as any other detected ions. Depending on the size of the scanned area, mass resolutions (defined as the center of a peak divided by its full width at half maximum) can be as high as 10,000.

After the extraction of the secondary ions is complete, a low-energy (18 eV) electron beam floods the scanned area for charge compensation until the next pulse of the primary ion beam is fired. This capability enables ToF-SIMS to be applied to highly insulating materials. All of these processes occur within a single cycle time. During each cycle, the first ion to reach the detector is typically a hydrogen ion, while the heaviest ions arrive last—determined by the time window allocated for ion detection. For example, with a cycle time of 100 μs (or a repetition rate of 10 kHz), the cutoff is around m/z 900—anything heavier than this will not reach the detector before the system starts the next cycle. Therefore, to detect higher mass species, the cycle time must be increased (e.g., m/z up to 1600 can be covered by a cycle time of >140 μs). The base pressure of the analysis chamber of a ToF-SIMS instrument can be as good as 1×10⁻⁹ mbar. However, it will work with no problems even if at pressures around 1×10⁻⁵ mbar.
- parallel detection: all generated ions are recorded.
- high mass resolution: up to 10,000.
The primary beam rasters the sample surface pixel by pixel (e.g., 128 pixels × 128 pixels) over the scanned area (e.g., 500 μm × 500 μm). Each pixel has a mass spectrum, enabling ion imaging when the intensities of selected ions are plotted against the pixels. Ion images reveal the spatial distributions of chemicals over the scanned area. The spatial resolution is a couple of microns in high mass resolution mode (the so-called high current bunched mode). The primary ion fluence is usually controlled at ~1011 ions/cm2, which is much less than the static limit of ~1013 ions/cm2. This is why ToF-SIMS is referred to as static SIMS, meaning that the surface is not significantly altered after measurement, allowing the same surface to be subjected to other analyses. Accordingly, with a sputter ion beam (e.g., Cs+ and C60+) used to remove a controllable portion of materials, ToF-SIMS is also capable of elemental and molecular depth profiling.
ToF-SIMS is highly surface-sensitive, probing only the outermost 1-3 nm of the surface. Due to varying ion yields for different species and changes in these yields based on the chemical environment (matrix effect), ToF-SIMS is not a quantitative technique. Quantification of specific elements requires a reference. Therefore, it is not practical to compare different species within the same sample. However, ToF-SIMS results, specifically ion intensities, can be conveniently used to compare the same species across different samples. For example, one might find that sodium (Na+) is several times more abundant in one sample compared to another.
ToF-SIMS secondary ion mass spectra are rich in chemical information, capturing all ions generated during the bombardment by the primary ion beam. This technique often provides unique chemical selectivity for organic materials through characteristic ions, often molecular ions. This capability allows for the exploration and development of unique analytical approaches to reveal surface chemistry and identify chemical structures.
ToF-SIMS is also referred to as static SIMS because it collects chemical information from the surface while sputtering off 1% or less of the topmost layer of the specimen, thus leaving the surface chemistry essentially undiminished. The term “static” is used to contrast with dynamic SIMS, which was developed prior to static SIMS. In dynamic SIMS, the primary ion beam sputters through the specimen while detecting its chemical constituents, making it suitable for applications in depth profiling elements (e.g., dopants in semiconductors and precious metals in ores).
Ion mass spectra
Surface sensitivity and chemical selectivity of ToF-SIMS
ToF-SIMS is characterized by its surface sensitivity and chemical selectivity. For instance, if there is only a monolayer of some molecules, many other techniques may lack either surface sensitivity or chemical selectivity, or both. In contrast, a monolayer of a substance is more than enough to be detected by ToF-SIMS. As an example, the negative (upper panel) and positive (lower panel) secondary ion mass spectra shown below were obtained from a stain visible on a metal substrate, which only showed slightly increased carbon levels when detected by two other techniques. ToF-SIMS helped identify the stain as being due to the presence of diacylglycerides (also called diglycerides). The fatty acid chains are seen as negative ions corresponding to fatty acids, such as palmitate C16H31O2¯
at m/z 255 and myristate C14H27O2¯
at m/z 227. With the removal of a hydroxyl group (OH) from the glyceryl link, glyceryl dipalmitate (C16H31O2)2C3H5+
is detected as a positive ion at m/z 552. As seen in the spectra, other combinations with different fatty acids are also detected.

Another example for identification of Cyanox 1790, whose molecular formula is [M=C3O3N3(C13H19O)3], is shown below. The molecular ions M+ and [M-H]¯ are detected at m/z 699 and 698, respectively, though both are rather weak. The more abundant ions are C13H19O+ at m/z 191
and C3O3N3(C13H19O)2¯ at m/z 508. This example, along with the previous one, demonstrates the superior chemical selectivity of ToF-SIMS.

- extremely surface sensitive
- superb chemical selectivity
Vancomycin. with the molecular formula, M=C66H75Cl2N9O24, is a Gram-positive bacteria antibiotic. Shown below are negative and positive secondary ion mass spectra for a vancomycin layer spin-coating on a cleaved mica substrate. There is an abundant negative ion at m/z 155 and an abundant positive ion at m/z 100. These peaks have been identified as C7H4O2Cl¯ and C6H14N +, respectively.
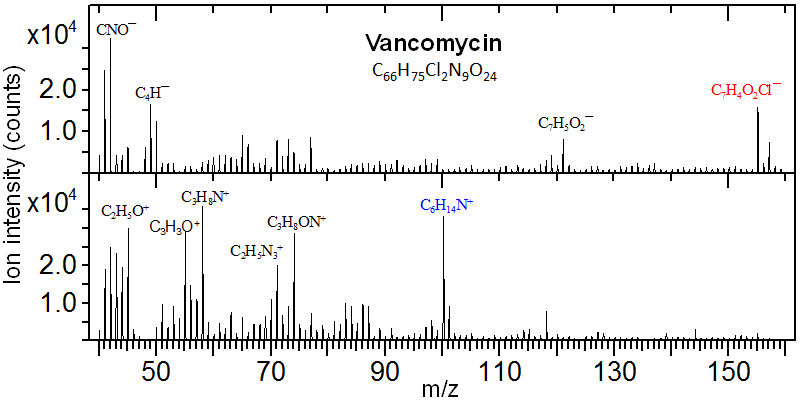
These two ions are fragmented from the two structural moieties of the vancomycin molecule illustrated below. Additionally, though at much lower intensities, the protonated molecular ion [M+H]+ (m/z 1448) and decarboxylated molecular ion [M-COOH]¯ (m/z 1402) were also detected.

Other chemicals, such as pigments, antibiotics, and surfactants, have been examined. Their molecular ions are often detected using ToF-SIMS, and they usually also have diagnostic fragmented ions. To reiterate, the superior chemical selectivity and surface sensitivity of ToF-SIMS often make it powerful in investigating surface contaminants. These contaminants may be as thin as a couple of nanometers, yet they can be either visible and/or impact the surface chemistry of the contaminated substrate.
Isotopes of elements
ToF-SIMS is also useful for detecting isotopes of elements and molecules containing them. For substances that are not isotope-enriched, the ion mass spectra show the natural abundance of the isotopes. In fact, the isotope distribution pattern of an element is a useful property for identifying elements and molecules/fragments. Shown below are ion mass spectra for tin, copper, and a fragment ion AuCl2.

Shown below is the negative secondary ion mass spectrum of Pigment Yellow 110 (M=C22H6Cl8N4O2). The pigment molecule has eight chlorine atoms, each of which has two isotopes at m/z 35 and 37, resulting in a complex group of peaks for the deprotonated molecular ion. The most abundant peak is called the monoisotopic peak, which in this case is at m/z 641. These isotope patterns can be checked using the Isotope Distribution Calculator and Mass Spec Plotter provided by Scientific Instrument Services.

Ion mass spectra of silicones
Silicones are widely used in plastic industry as release agents and paint systems as wetting agents. They are also common in many personal cosmetic products. Consequently, through plastic packaging and handling silicones often contaminate the surfaces of various objects. Due to their low surface energy (~24 mJ/m2), silicones can cause adhesion failures and paint defects. Even trace amounts of silicones can significantly alter the surface energy of the contaminated substrate. ToF-SIMS is particularly powerful in identifying siloxane contamination as the cause of automotive paint craters, thanks to its superior surface sensitivity and chemical selectivity.
Shown below are negative secondary ion mass spectra of different silicones. While both spectra contain identical ions, the ion intensity ratios between some ions differ for the two silicones. This is crucial chemical information because it helps differentiate molecules that contain the same elements. For example, for the two silicones, the ion intensity ratios for ions at m/z 89 (SiC3H9O¯) and 91 (SiC2H7O2¯), as well as those at m/z 163 (Si2C5H15O2¯) and 165 (Si2C4H13O3¯), are reversed. This difference is indeed a reflection of the abundance and lack of Si(CH3)3 in polydimethylsiloxanes and cyclosiloxane, respectively. This trend is also observed for Sylgard 184, a silicone elastomer kit from Dow Corning, with varying degrees of cross-linking.
Shown below is a list of the major negative and positive ions (and their m/z) fragmented from silicones, along with the fragmentation patterns based on the molecular formula of poly(dimethyl siloxane) (PDMS), a silicone oil.
- Si¯ (m/z 27.977)
- SiCH3O¯ (58.995)
- SiC2H5O¯ (73.011)
- SiCH3O2¯ (74.991)
- SiC3H9O¯ (89.043)
- SiC2H7O2¯ (91.021)
- Si2C3H9O3¯ (149.009)
- Si2C5H15O2¯ (163.061)
- Si2C4H13O3¯ (165.041)
- Si3C5H15O4¯ (223.027)
- Si3C7H21O3¯ (237.081)
Negative ions
- Si+ (m/z 27.977)
- SiC3H9+ (73.047)
- Si2C5H15O+ (147.065)
- Si3C5H15O3+ (207.033)
- Si3C7H21O2+ (221.086)
- Si4C7H21O4+ (281.051)
- Si5C7H21O5+ (325.024)
- Si5C9H27O5+ (355.070)
Positive ions

- Silicones, due to their low surface energy, are widely used as wettability enhancers and release agents.
- However, this same surface property can cause failures when silicones contaminate a substrate that is subjected to adhesion or painting applications.
Ion images
Automotive paint craters
ToF-SIMS imaging is invaluable for studying the localization of chemicals on a surface. This technique is particularly useful when the presence of a chemical is critical but may be overlooked due to the weak intensities of its ions, which can result from its minimal size when only considering the ion mass spectra collected over a scanned area. For instance, paint craters can be caused by tiny perfluorocarbon particles. These particles, with their low surface energy (approximately 18 mJ/m2), obstruct the wetting of the paint, and their contribution to the mass spectrum collected over a large area may be buried or hardly noticeable. However, by mapping the scanned area, say 500 μm × 500 μm, even a perfluorocarbon particle just a few microns across can be detected due to its contrast. This approach is essential in ToF-SIMS studies on the causes of paint craters. Shown below are positive ion images of an automotive paint crater caused by a perfluorocarbon particle. Perfluorocarbons are characterized by C+, CF+,
CF3+ and C3F5+,
as well as other CxFy+ ions.
- imaging critical for identifying tiny low-surface-energy particles that cause paint craters.
Other chemicals classified to cause automotive paint cratering include silicones, fatty acids and detergents. The common property of those agents lies in their low surface energy, perhaps ranging in 20-25 mJ/m2. It is worth noting that silicones are also used as an ingredient in some paint systems to enhance wettability. In this case, silicones lower the surface tension (measured in mN/m, numerically equivalent to surface energy in mJ/m2) of the paint, allowing it to better wet a substrate that does not necessarily have high surface energy. Most plastics, unless modified to increase surface energy, typically have a low surface energy, around 25-35 mJ/m2. Paint craters form when the paint cannot wet a spot on the substrate due to its lower surface energy, which may be caused by the presence of a particle with even lower surface energy. Therefore, both aggregates of silicones in the paint system and contamination by foreign silicones can cause paint craters. It is sometimes necessary to determine which is the case when silicone is found to cause the crater. In such instances, comparing negative silicone ions at m/z 89 and 91 and at m/z 163 and 165, as described earlier , can be quite helpful.
The automotive painting process, which includes substrate preparation, primer, basecoat and clearcoat, accounts for roughly one-third of the cost of manufacturing vehicles. The appearance of a car significantly influences customers’ purchasing decisions. Paint cratering can lead to a shutdown of the production line. ToF-SIMS is the most effective technique for identifying the causes of paint cratering, as it often relates to tiny particles or extremely thin layers of materials with low surface energy. Detecting these defects requires the surface sensitivity and chemical selectivity that only ToF-SIMS can provide. Based on a decade-long study of nearly 1,000 automotive paint craters, the distribution of chemicals responsible for these craters is illustrated, followed by a table detailing their characteristic ions, along with their nominal m/z values.
- Findings from the pie chart include:
Antiperspirant (2%) – This likely originates from personal care products; the particels are usually coated with cyclic silicones.
Perfluorocarbons (11%) & Perfluoropolyethers (6%) – Found in lubricants and gaskets, these materials have extremely low surface energy.
Other Surfactants (21%) – Including fatty acids, alkyl sulfates, and erucamide, often from detergents or plastic additives.
Unknown (17%) – Some craters showed no identifiable residue, which is likely partially dependent on the analyst.
Nothing Different Detected (18%) – This suggests that the responsible chemicals were either volatile or buried beneath the coating.
| Chemical | Ion (nominal m/z) |
|---|---|
| Siloxane | Si+ (28), SiC3H9+ (73), Si2C5H15O+ (147), Si3C5H15O3+ (207), Si3C7H21O2+ (221), Si4C7H21O4+ (281), Si¯ (28), SiCH3O¯ (59), SiC2H5O¯ (73), SiCH3O2¯ (75), SiC3H9O¯ (89), SiC2H7O2¯ (91), Si2C3H9O3¯ (149), Si2C5H15O2¯ (163), Si2C4H13O3¯ (165), Si3C5H15O4¯ (223), Si3C7H21O3¯ (237) |
| Perfluorocarbons | C+ (12), CF+ (31), CF3+ (69), C3F3+ (93), C2F4+ (100), C2F5+ (119), C3F5+ (131), F¯ (19), CF3¯ (69) |
| Perfluoropolyethers | C+ (12), CF+ (31), COF+ (47), CF3+ (69), C2OF3+ (97), C3OF5+ (147), F¯ (19), COF¯ (47), CF3¯ (69), COF3¯ (85), C2OF5¯ (135), C3O2F5¯ (163), C3OF7¯ (185) |
| Fatty acids | Caprylate C8H15O2¯ (143), Caprate C10H19O2¯ (171), Laurate C12H23O2¯ (199), Myristate C14H27O2¯ (227), Palmitoleate C16H29O2¯ (253), Palmitate C16H31O2¯ (255), Linoleate C18H31O2¯ (279), Oleate C18H33O2¯ (281), Stearate C18H35O2¯ (283) |
| Antiperspirant | This is identified by ions from cyclic siloxanes, similar to those listed in Siloxane, along with metallic element analysis via scanning electron microscopy with energy dispersive X-ray spectroscopy, as the particles are often wrapped by siloxanes. |
| Polyisobutylene | With C4H8+ (56) and C7H13+ (97) being much more abundant than other hydrocarbons compared to adjacent hydrocarbon ions CxHy+. |
| Alkyl sulfates | SO3¯ (80), SO4H¯ (97), C12H25SO4¯ (265), C14H29SO4¯ (293) |
| Alkylbenzene sulfonate | SO3¯ (80), C8H7SO3¯ (183), C16H25SO3¯ (297), C17H27SO3¯ (311), C18H29SO3¯ (325), C19H31SO3¯ (339) |
| Erucamide | C3H6NO+ (72), C22H44NO+ (338), CN¯ (26), CNO¯ (42), C22H42NO¯ (336) |
| Dimethyldioctade-cylammonium | C3H8N+ (58), C20H44N+ (298), C23H76N+ (523), C38H81N+ (551) |
Differentiating fatty acids and their salts
Shown here is a composite image of Si+ (blue), C16H33O2+ (green) and C16H33O2Na2+
(red).  This image demonstrates the excellent chemical selectivity of ToF-SIMS, as it differentiates palmitic acid from its salt (sodium palmitate). In the salt form, almost no C16H33O2+ is
detected. Both the acid and its salt, however, have abundant negative ion C16H31O2¯ (not shown).
Thus, the chemical selectivity for this acid and its salt lies in the positive ions rather than the negative ones. This also applies to other fatty acids and their salts. This observation can be explained by the fact that for a fatty acid to become a protonated molecular ion, it only needs to acquire one hydrogen atom or proton. In contrast, for the salt of a fatty acid to become a protonated molecular ion, it must acquire two hydrogen atoms or protons. This ion formation process is hindered by the presence of the cation (e.g., Na+). The ToF-SIMS results suggest that it is easier for the salt to acquire one more cation to become a positive ion of the salt with an extra cation than to capture two hydrogen atoms or protons.
Phase separation
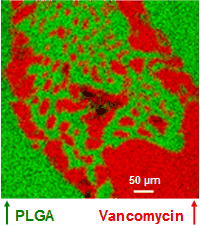
Phase separation of the antibiotic vancomycin and its polymeric matrix poly(lactide-co-glycolide) (PLGA) was observed when dimethyl sulfoxide (DMSO) was used as the solvent. The sample was prepared by placing the solution on a cleaved mica substrate. The phase separation is evident in the ion images of C7H4O2Cl¯ (at m/z 155, representing vancomycin) and C6H7O5¯ (representing PLGA). For the vancomycin molecule, C7H4O2Cl¯, along with its isotope ion C7H4O237Cl¯ (not shown), is a diagnostic ion that is both abundant and a structural entity of the molecule. Additionally, sulfur species were found in the vancomycin phase, suggesting a possible interaction between vancomycin and DMSO.
Depth profiling
Metal oxides
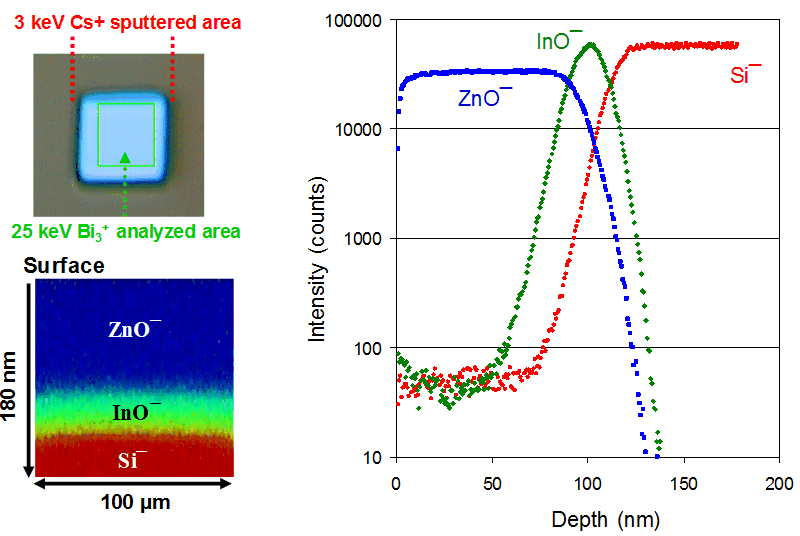
Assisted by a sputter ion beam, ToF-SIMS can be used to depth profile both inorganic and organic materials. In practice, an area is sputtered for a predetermined period, followed by analyzing the newly generated surface within the sputtered area, which provides a data point in the depth profile. This sputter/analysis cycle is repeated until the desired depth is profiled. In most cases, the depth of the crater generated from depth profiling is measured using either a mecahnical stylus or an optical profilometer to calibrate the depth. Otherwise, the depth information is expressed by sputter time. Subnanometer depth resolutions are readily achievable. Shown below are an optical image (top left corner) of the crater after depth profiling and depth profiles (right) of a layered structure of ZnO/In2O3/Si using a 3 keV Cs+ sputter beam and a 25 keV Bi3+ analysis beam. The zinc oxide layer is represented by ZnO¯, indium by InO¯ and silicon by Si¯. Also shown is a cross-section image of the profiled depth. Note that the vertical dimension represents the profiled depth, while the lateral dimension represents the scanned area.
- dual beam approach for depth profiling
- subnanometer depth resolutions
- powerful for investigating deposited thin films and native oxide layers
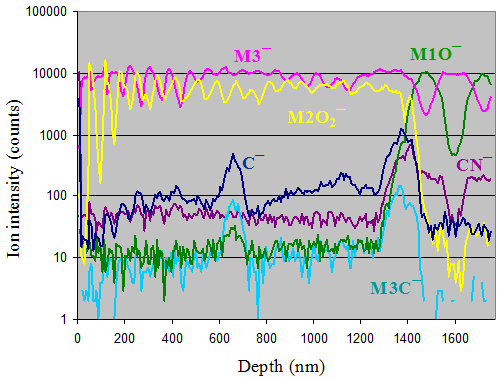 Shown here are depth profiles for a structure consisting of alternating layers of different oxides of metals M1, M2, and M3. Carbon and carbon-related ions are also displayed. A peak of carbon is observed in the middle of the film, suggesting increased carbon levels due to an interruption during the deposition process (i.e., accumulation of hydrocarbons in vacuum). Therefore, ToF-SIMS depth profiling is powerful for investigating the quality and integrity of layered structures.
Layered organics
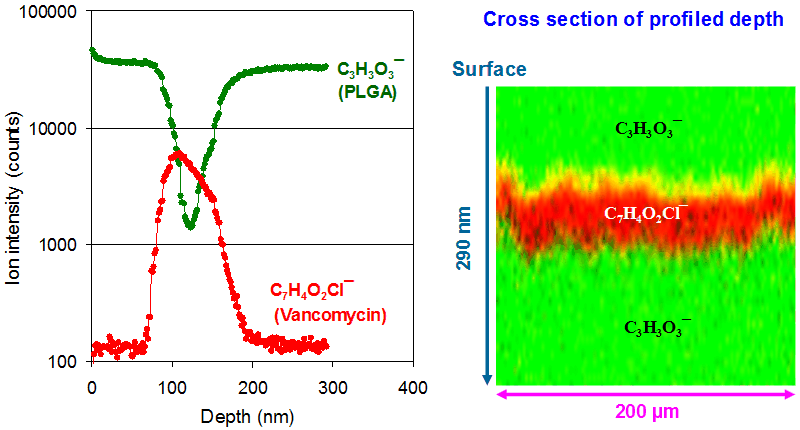
Depth profiling organic materials often requires appropriate sputter ion beam that will not significantly degrade the molecules. C60+ is an effective sputter beam for many organic materials. Vancomycin is used to showcase the ability of ToF-SIMS to perform three-dimensional molecular imaging. Shown below are the depth profiles of C7H4O2Cl¯and C3H3O3¯, representing vancomycin and PLGA, respectively. The ion intensities for a single depth are the sums of those over the scanned area. Since each pixel has a full spectrum over the scanned area for all probed depths, ToF-SIMS provides a three-dimensional distribution of chemical information. For example, shown on the right-hand side in the following figure is a cross-section, i.e., an x-z plane cut from the profiled depth. Note that the vertical direction represents the depth (z, 290 nm) and its scale is different from the dimension (x, 200 μm) of the scanned area.
Quantifying cross-linking degrees of PMMA
 An approach based on ToF-SIMS was developed to determine the degree of cross-linking on the surface and its variations in a nanometer-scale depth of organic materials. ToF-SIMS is extremely surface-sensitive and capable of depth profiling using a sputter ion beam to remove controllable amounts of substance. Poly(methyl methacrylate) (PMMA) films spin-coated on a Si substrate were cross-linked using a recently developed, surface-sensitive, hyperthermal hydrogen projectile bombardment technique. The ion intensity ratio between two ubiquitous hydrocarbon species C6H¯ and C4H¯, detected in ToF-SIMS, denoted as ρ, was used to assess the degree of cross-linking of the PMMA films. The cross-linking depth of the PMMA films was revealed by depth profiling ρ into the polymer films using the C60+ sputter beam.
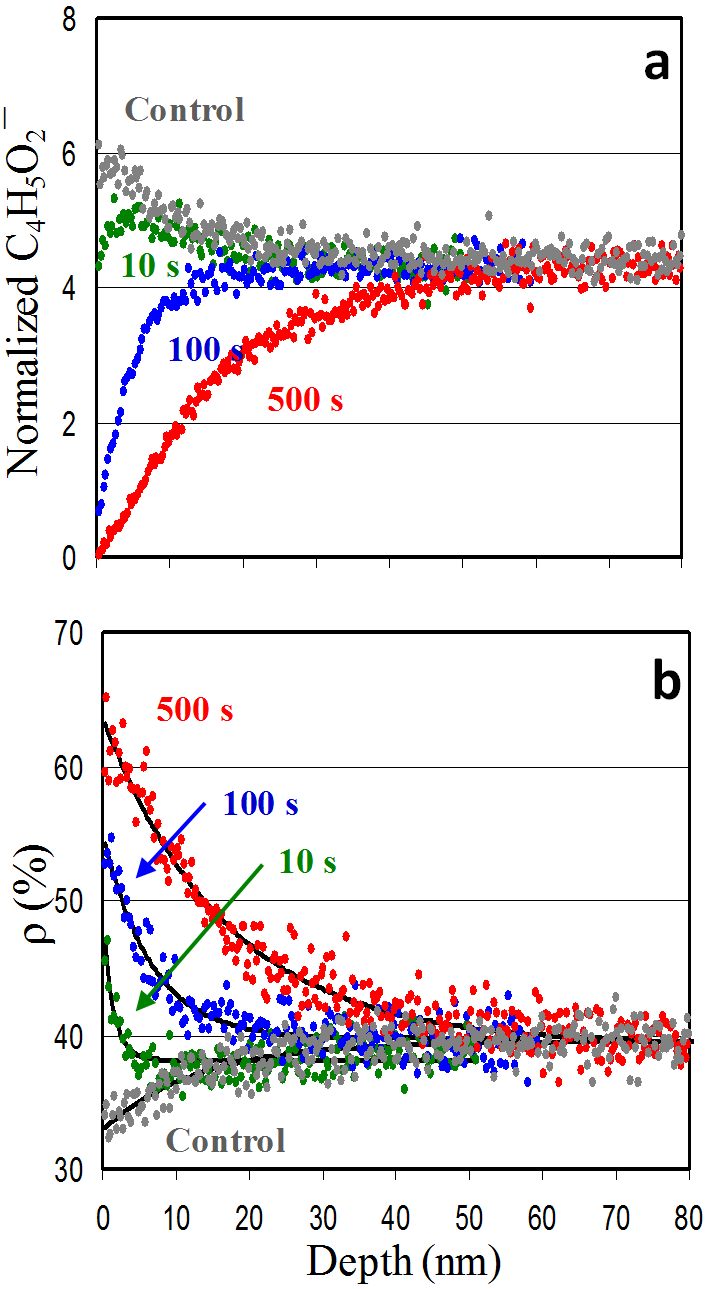
The control PMMA film spin-coated on a Si substrate was characterized by ρ=32% on its surface when using a 25 keV Bi3+ primary ion beam. This parameter on the PMMA films subjected to HHIC treatment for 10, 100, and 500 seconds increased to 45%, 56%, and 65%, respectively. The depth profiles of ρ obtained using a 10 keV C60+ ion beam resembled an exponential decay, from which the cross-linking depth was estimated to be 3, 15 and 39 nm, respectively, for the three cross-linked PMMA films.
As shown in panel (a) of the figure, the characteristic PMMA ion C4H5O2¯ indicates the variation of cross-linking degree of PMMA. Panel (b) shows that the ion intensity ratio ρ between C6H¯ to C4H¯ detected in ToF-SIMS provides a unique and simple means to assess the degree of cross-linking of the surface of PMMA films cross-linked by the surface sensitive hyperthermal hydrogen projectile bombardment technique. The ToF-SIMS approach is capable of depth profiling ultra-thin organic films with subnanometer resolutions.
- opportunities to developing new analytical approaches
Principal component analysis of CnH¯ ions
The rich chemical information provided by ToF-SIMS ion mass spectra lies in the form of fragmented ions, often numbering in the hundreds. This abundance of ions enables the identification of chemicals and the exploration of surface chemistry. Given the daunting number of ions (i.e., variables) detected in ToF-SIMS, dimensionality reduction techniques such as principal component analysis (PCA), a multivariate data analysis method, have proven useful. PCA reveals similarities or differences in ions based on the variability of their intensities and can differentiate polymers with different molecular weights or different types of polymers.
In Principal Component Analysis (PCA), the data of the original variables (such as ions in the ToF-SIMS case) are transformed into a set of data (scores) of new orthogonal variables called principal components (PCs). Shown below is an example of a original data table and the transformed PCA scores. These PCs are linear combinations of the original variables. The transformation is designed so that the first PC accounts for the maximum possible variance in the original data, with subsequent PCs capturing the remaining variance. Although the number of PCs equals the number of original variables, higher PCs can often be discarded without significant loss of information if the first few PCs explain the majority of the variance, thus achieving dimensionality reduction. However, PCA is purely a mathematical transformation of the original data; interpreting what the first PCs represent is inherently specific to the data or problem at hand.
- As a dimensionality reduction technique, PCA enables visualization of clustering (or lack thereof) among observations through the first two or three principal components (PCs). It also reveals the contributions of variables to clustering and the relationships among variables.
PCA allows for the comparison of PCA scores transfromed from the original observations and loading vectors associated with the original variable using a biplot. This biplot is created by plotting the PCA scores of the observations on two principal components (PCs), often the first two, overlaid with a plot of the PCA loadings of the variables on the same two PCs. This PCA and biplot appraoch allows visualization of the similarities and differences among the multivariate observations, their relationships with the variables, and the correlations between the variables.
Shown in the biplot below is a covariance biplot for the scores of the observations as points and loadings of the variables as arrowed lines, both on PC1 and PC2, for polyethylene (PE), polypropylene (PP), polyisoprene (PIP) and polystyrene (PS), as well as polymethyl methacrylate (PMMA) with different cross-linking degrees. The PCA results were obtained from a data set for the four polymers against the 10 CnH¯ (n=1 to 10) ions, using the prcomp() function in the open-source R language. This function is based on singular value decomposition , ( svd() function in R), returning scores of observations, loadings of variables, and eigenvalues (i.e., variances of PCs).
The score of an observation on a PC is the sum of the individual ion intensity of each variable multiplied by the loading of the corresponding variable on the
PC. In other words, it is the projection of all the CnH¯
intensities of an observation on a PC, representing how an observation is expressed as a single point on the PC axis. A score plot is used to determine similarities or differences among observations. The score plot in the figure illustrates the clustering of the polymers, including the differently cross-linked PMMA.

An arrowed line representing a variable in a biplot is called a "variable vector," indicating the direction of the variable in the principal component (PC) coordinates. The smaller the angle between the variable vectors of two CnH¯ ions, the more similarly the two variables behave in terms of their variability in ion intensities. In other words, two variables are positively correlated if the angle between their variable vectors is close to 0°, and negatively correlated if the angle is close to 180°. Conversely, an angle close to 90° indicates that the two variables are not correlated at all.
The loading plot in the figure clearly shows the similarities among C6H¯ to C10H¯ ions due to their significant contributions to PC1. In contrast, the variable vectors of C2H¯ and C3H¯ ions point in approximately the opposite direction and have increased loadings on PC2. This indicates that the intensities of the two groups of ions vary in opposite directions; that is, when the ion intensities of one group measured on a polymer sample increase, those of the other group decrease.
- PC1 captures the variability of "carbon density" of the five polymers.
Assisted by the PCA results, we confirmed that polymers with lower and higher “carbon density” favor the formation of smaller (e.g., C2H¯ and C3H¯ and larger (i.e., C6H¯ to C10H¯) CnH¯, respectively. Moreover, we found that the variability of the C4H¯ intensity across different polymers is relatively small compared to other CnH¯ intensities. The PCA results shown in the figure verified our argument that with increased "carbon density", the ion intensities of larger CnH¯ increase while those of smaller CnH¯ decrease. Therefore, it is the "carbon density" of polymers that dictates the variability of CnH¯ captured by PC1.
