- probing the outermost 1-3 nm surface
- identifying organic molecules via characteristic and molecular ions
- imaging and depth profiling for 2D and 3D chemical distributions
How ToF-SIMS works?
In ToF-SIMS, such as the IONTOF
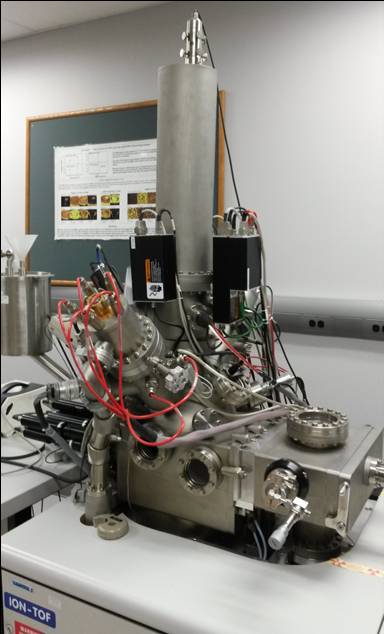 TOF-SIMS IV at Surface Science Western, a pulsed (~1 ns) primary ion beam (e.g., 25 keV Bi3+) is used to bombard the sample surface. This bombardment generates secondary particles — including ions, electrons, and neutral particles — which carry chemical information about the surface. Depending on the polarity of the electric field applied between the extractor and the sample stage, either positive or negative ions are extracted one at a time (e.g., at 2 kV). The extracted ions gain a kinetic energy of 2 keV (assuming they are singly charged) and then travel through a flight tube approximately 2 m in length. Lighter ions fly faster and reach the detector before heavier ones.
The detection system consists of three sequentially connected components: (1) a microchannel plate that generates an electron cascade, (2) a scintillator that converts these electrons into photons, and (3) a photomultiplier tube that amplifies the resulting photons and converts them into electrical pulses representing the intensities of the detected ions.
The basic concept of ToF-SIMS is illustrated below (for positive ion extraction; the polarity of the extraction electric field is reversed for negative ion extraction).
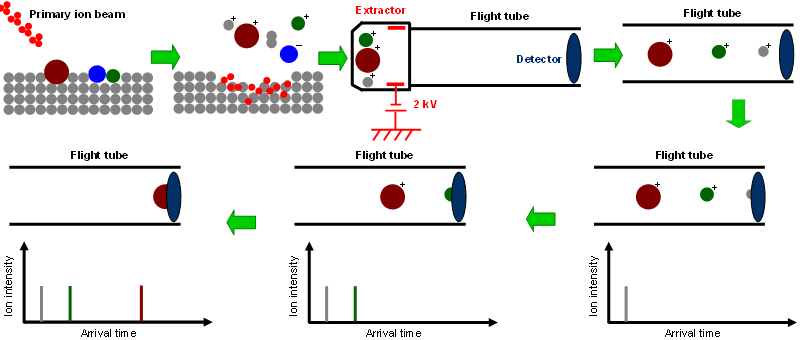
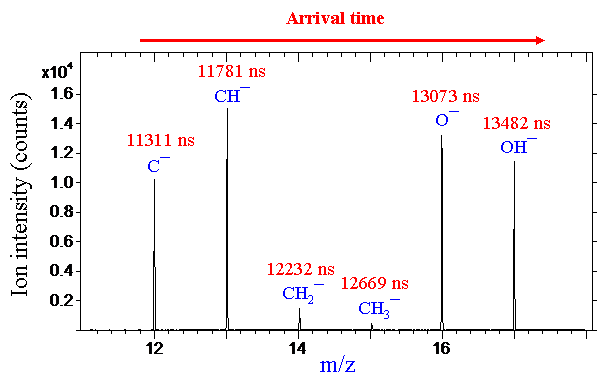
The ions arrive at the detector based on their flight times, which are determined by their mass-to-charge ratio (m/z). As illustrated in the following figure, the measured arrival times of ions are converted to m/z through calibration with known species such as hydrogen, carbon, and hydrocarbons, as well as any other detected ions with known masses. Depending on the size of the scanned area, mass resolutions (defined as the centre of a peak divided by its full width at half maximum, m/Δm) can be as high as 10,000.
After extraction of the secondary ions is complete, a low-energy (18 eV) electron beam floods the scanned area for charge compensation until the next primary ion pulse is fired. This capability enables ToF-SIMS to be applied to highly insulating materials without charging artefacts. All of these processes occur within a single measurement cycle. During each cycle, the first ion to reach the detector is typically a hydrogen ion (H+), while the heaviest detected ions arrive last — determined by the time window allocated for detection. For example, with a cycle time of 100 μs (repetition rate of 10 kHz), the mass cutoff is around m/z 900. To detect higher-mass species, the cycle time must be increased (e.g., m/z up to 1600 can be covered with a cycle time exceeding 140 μs). The base pressure of the analysis chamber is typically as low as 1×10⁻⁹ mbar, although the instrument operates reliably at pressures around 1×10⁻⁵ mbar.
- parallel detection: all generated ions are recorded simultaneously in every cycle
- high mass resolution: up to m/Δm ≈ 10,000
- charge compensation: applicable to electrically insulating materials
The primary beam rasters the sample surface pixel by pixel (e.g., 128×128 pixels) over the scanned area (e.g., 500×500 μm). Since each pixel has an associated mass spectrum, ion images can be generated by plotting the intensities of selected ions against their spatial coordinates. These images reveal the spatial distributions of chemical species across the scanned area. The spatial resolution is a few microns in the high mass resolution (high-current bunched) mode. The primary ion fluence is maintained well below ~1011 ions/cm2, which is far less than the static limit of ~1013 ions/cm2 — hence the term static SIMS. Because the surface is not significantly altered by measurement, the same area can subsequently be analysed by other techniques. With a sputter ion beam (e.g., Cs+ or C60+) used to remove controlled amounts of material, ToF-SIMS is also capable of elemental and molecular depth profiling.
ToF-SIMS probes only the outermost 1–3 nm of the surface. Due to varying ion yields for different species and matrix-dependent yield changes (matrix effect), ToF-SIMS is not strictly quantitative without an appropriate reference standard. It is therefore not practical to directly compare different species within the same spectrum. However, the intensity of a given ion can conveniently be compared across different samples — for instance, to show that sodium (Na+) is several times more abundant on one surface than another.
ToF-SIMS secondary ion mass spectra are rich in chemical information, capturing all ions generated during primary beam bombardment. The technique often provides unique chemical selectivity for organic materials through characteristic fragment ions, and frequently also detects intact or near-intact molecular ions. This capability enables the development of bespoke analytical approaches for revealing surface chemistry and identifying chemical structures.
The term "static" contrasts with dynamic SIMS, in which the primary beam sputters continuously through the specimen while detecting chemical constituents. Dynamic SIMS was developed earlier and is suited to depth profiling of elements such as dopants in semiconductors or trace metals in ores, where molecular information is not required.
Ion mass spectra
Surface sensitivity and chemical selectivity of ToF-SIMS
ToF-SIMS is characterised by its surface sensitivity and chemical selectivity. Many surface analytical techniques lack one or both of these properties — particularly when the analyte is present only as a monolayer or submonolayer. In contrast, a single monolayer of molecules is more than sufficient for detection by ToF-SIMS.
As an example, the negative (upper panel) and positive (lower panel) secondary ion mass spectra shown below were obtained from a stain visible on a metal substrate, which had produced only slightly elevated carbon levels when examined by two other techniques. ToF-SIMS identified the stain as diacylglycerides (diglycerides). The fatty acid chains appear as negative ions corresponding to fatty acids — palmitate C16H31O2− at m/z 255 and myristate C14H27O2− at m/z 227. With loss of a hydroxyl group (OH) from the glyceryl linkage, glyceryl dipalmitate (C16H31O2)2C3H5+ is detected as a positive ion at m/z 552. Other combinations involving different fatty acid chain lengths are also evident in the spectra.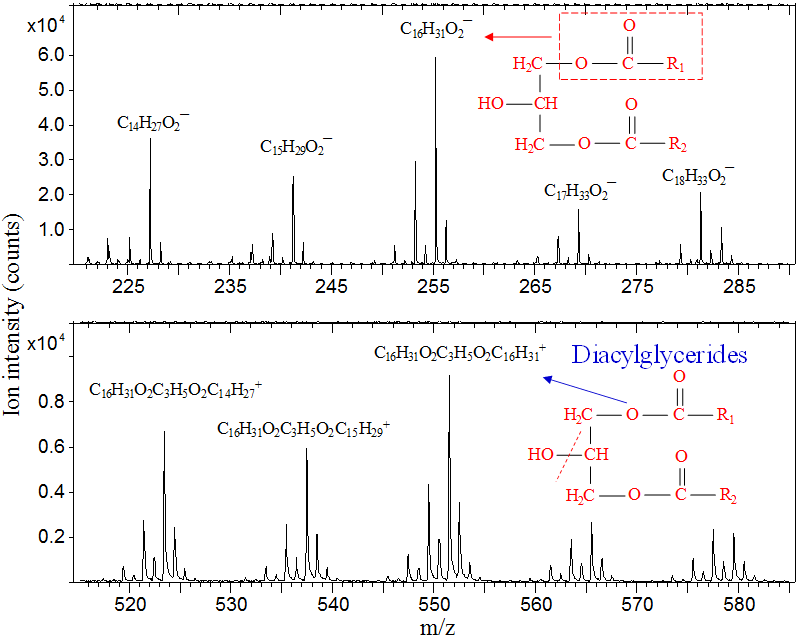
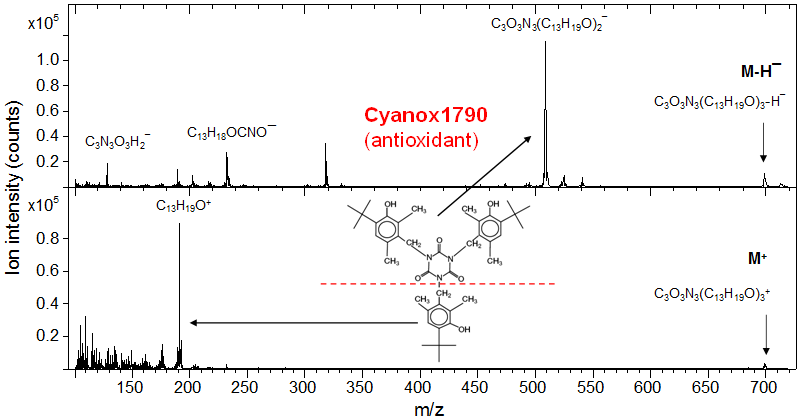
A further example is the identification of Cyanox 1790, whose molecular formula is [M = C3O3N3(C13H19O)3]. The molecular ions M+ and [M−H]− are detected at m/z 699 and 698, respectively, though both are relatively weak. More abundant ions are C13H19O+ at m/z 191 and C3O3N3(C13H19O)2− at m/z 508. This example, together with the diacylglyceride case above, demonstrates the superior chemical selectivity that ToF-SIMS provides.
- extremely surface sensitive: a monolayer or less is detectable
- superb chemical selectivity: molecular and fragment ions identify specific compounds
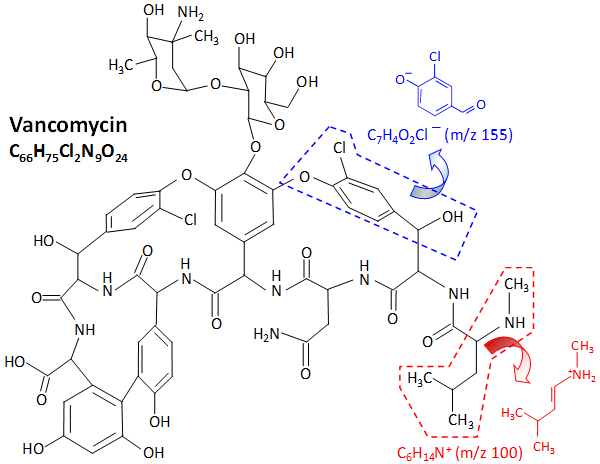
Vancomycin, with molecular formula M = C66H75Cl2N9O24, is a Gram-positive bacteria antibiotic. Shown below are negative and positive secondary ion mass spectra for a vancomycin layer spin-coated onto a cleaved mica substrate. An abundant negative ion appears at m/z 155 and an abundant positive ion at m/z 100. These peaks have been identified as C7H4O2Cl− and C6H14N+, respectively, both arising from distinct structural moieties of the vancomycin molecule.
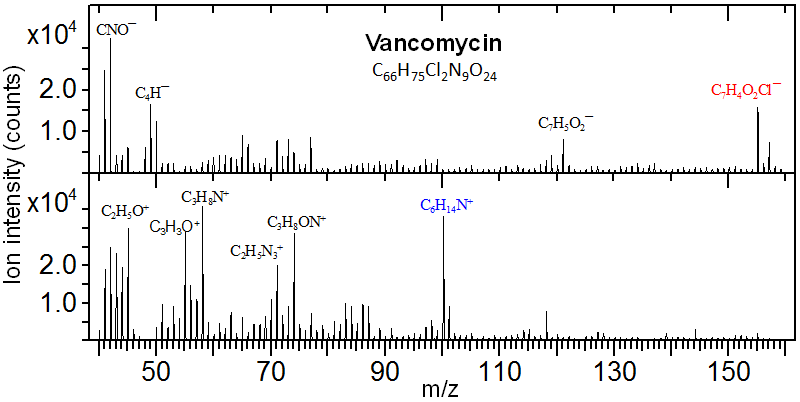
These two ions are fragmented from the two structural moieties of the vancomycin molecule illustrated below. Additionally, though at much lower intensities, the protonated molecular ion [M+H]+ (m/z 1448) and decarboxylated molecular ion [M−COOH]− (m/z 1402) were also detected.
Other chemicals — including pigments, antibiotics, and surfactants — have been characterised in a similar way. Their molecular ions are often detectable by ToF-SIMS, and diagnostic fragment ions further assist structural identification. The superior chemical selectivity and surface sensitivity of ToF-SIMS frequently make it indispensable for investigating surface contaminants that, though only a few nanometres thick, may be either visible or significantly alter the surface chemistry of the underlying substrate.
Isotopes of elements
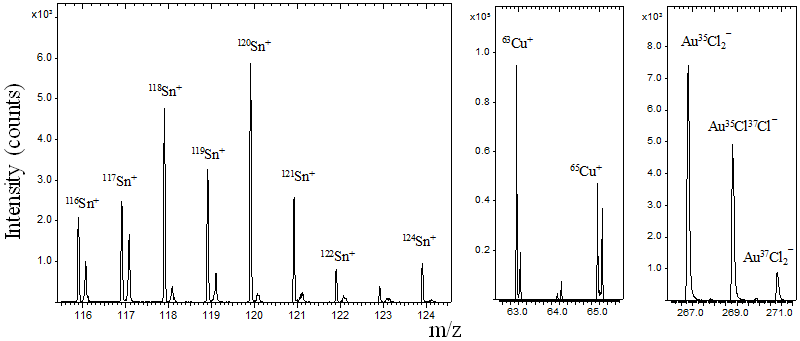
ToF-SIMS is useful for detecting the isotopes of elements and their molecular fragments. For non-enriched materials, the ion mass spectra reflect the natural isotopic abundance of each element. The characteristic isotope distribution pattern of an element is itself a valuable diagnostic property for identifying elements and molecules. Shown below are ion mass spectra for tin, copper, and the fragment ion AuCl2−, all displaying their characteristic multi-peak isotope envelopes.
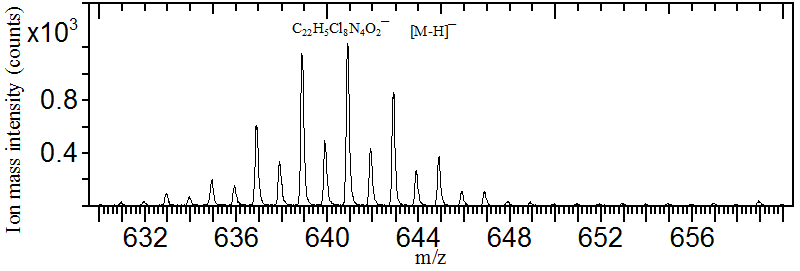
Shown below is the negative secondary ion mass spectrum of Pigment Yellow 110 (M = C22H6Cl8N4O2). The pigment molecule contains eight chlorine atoms, each with two naturally occurring isotopes at m/z 35 and 37, resulting in a complex multiplet pattern for the deprotonated molecular ion. The most abundant peak (the monoisotopic peak) appears at m/z 641. These isotope patterns can be predicted and verified using the Isotope Distribution Calculator and Mass Spec Plotter provided by Scientific Instrument Services.
Ion mass spectra of silicones
Silicones are widely used in plastic industry as release agents and paint systems as wetting agents, and are also common in many personal cosmetic products. Through plastic packaging and routine handling, silicones frequently contaminate the surfaces of diverse objects. Owing to their low surface energy (~24 mJ/m2), silicones can cause adhesion failures and paint defects. Even trace quantities of silicones can significantly alter the surface energy of a contaminated substrate. ToF-SIMS is particularly powerful in identifying siloxane contamination as the root cause of automotive paint craters, thanks to its unmatched surface sensitivity and chemical selectivity.
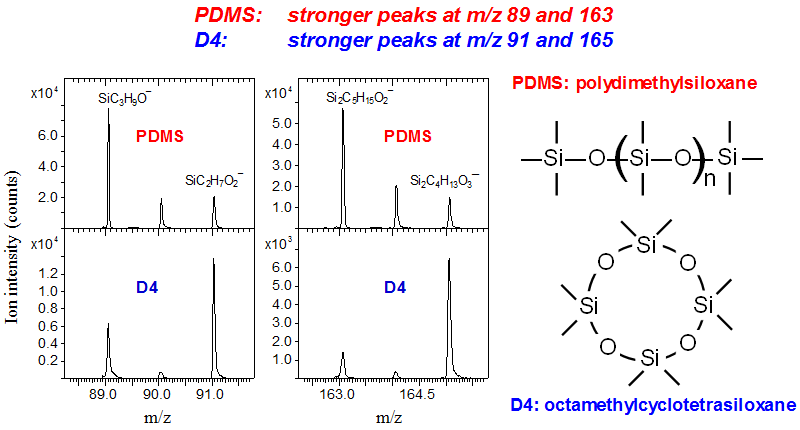
Shown below are negative secondary ion mass spectra of two different silicone types. While both spectra contain the same characteristic ions, the relative intensity ratios between certain ions differ between the two. This contrast carries important chemical information because it differentiates molecules sharing the same elemental composition. For example, the intensity ratios of ions at m/z 89 (SiC3H9O¯) and 91 (SiC2H7O2¯), and of those at m/z 163 (Si2C5H15O2¯) and 165 (Si2C4H13O3−), are reversed for the two silicones. This reversal reflects the relative abundance of Si(CH3)3 end-groups in polydimethylsiloxane versus their absence in cyclosiloxanes. This trend is also observed for Sylgard 184, a silicone elastomer kit from Dow Corning, across varying degrees of cross-linking.
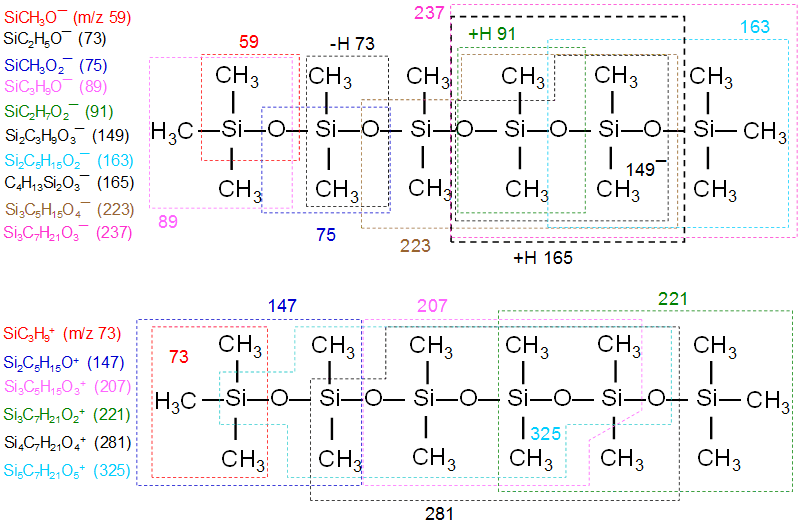
Listed below are the major negative and positive ions (with their m/z values) generated from silicones, together with the fragmentation patterns based on the molecular formula of poly(dimethyl siloxane) (PDMS).
- Si¯ (m/z 27.977)
- SiCH3O¯ (58.995)
- SiC2H5O¯ (73.011)
- SiCH3O2¯ (74.991)
- SiC3H9O¯ (89.043)
- SiC2H7O2¯ (91.021)
- Si2C3H9O3¯ (149.009)
- Si2C5H15O2¯ (163.061)
- Si2C4H13O3¯ (165.041)
- Si3C5H15O4¯ (223.027)
- Si3C7H21O3¯ (237.081)
Negative ions
- Si+ (m/z 27.977)
- SiC3H9+ (73.047)
- Si2C5H15O+ (147.065)
- Si3C5H15O3+ (207.033)
- Si3C7H21O2+ (221.086)
- Si4C7H21O4+ (281.051)
- Si5C7H21O5+ (325.024)
- Si5C9H27O5+ (355.070)
Positive ions
- Silicones, due to their low surface energy, are widely used as wettability enhancers and release agents.
- However, this same surface property causes failures when silicones contaminate substrates subject to adhesion or painting applications.
- The reversal of intensity ratios at m/z 89/91 and 163/165 differentiates the cross-linking degree in polydimethylsiloxane.
Ion images
Automotive paint craters
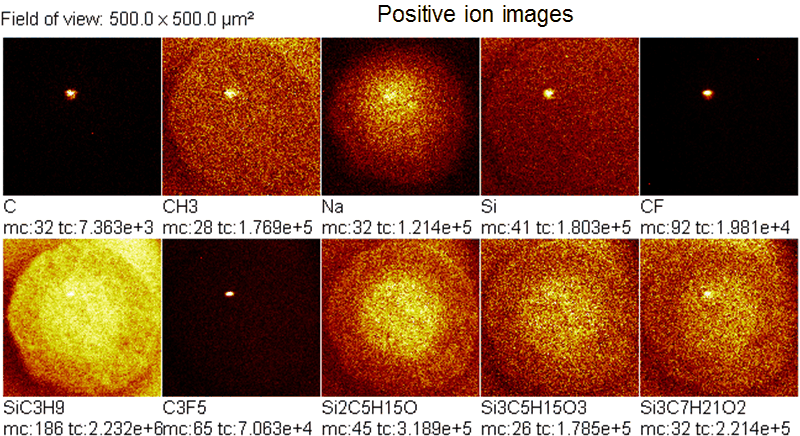
ToF-SIMS imaging is invaluable for studying the localisation of chemicals on a surface. This capability is particularly important when a causative chemical is present only as a tiny particle — its contribution to the total-area mass spectrum may be negligible, yet its local contrast in an ion image makes it unambiguously detectable. For instance, paint craters can be caused by perfluorocarbon particles just a few microns across. With a surface energy of approximately 18 mJ/m2, these particles locally prevent the paint from wetting the substrate. Shown below are positive ion images of an automotive paint crater caused by a perfluorocarbon particle. Perfluorocarbons are characterised by C+, CF+, CF3+, C3F5+, and other CxFy+ ions.
- imaging is critical for identifying tiny low-surface-energy particles that cause paint craters
- ion contrast reveals micrometer-sized particles invisible in total-area spectra
Other chemicals classified as causes of automotive paint cratering include silicones, fatty acids, and detergents, all sharing a surface energy in the range of approximately 20–25 mJ/m2. It is worth noting that silicones are also intentionally incorporated into some paint systems as wetting agents, where they lower the surface tension of the paint to improve spreading over substrates that do not have inherently high surface energy. Most plastics, unless surface-treated to increase their surface energy, typically present a surface energy of around 25–35 mJ/m2. Paint craters form when a paint cannot wet a particular spot on the substrate because a contaminant there has even lower surface energy — whether an aggregate of silicones already present in the paint formulation, or a foreign silicone contaminant introduced during the painting process. Distinguishing between these two origins can be important; in such cases, comparing the negative silicone ion ratios at m/z 89/91 and 163/165 (described above) can be diagnostic.
The automotive painting process — encompassing substrate preparation, primer, basecoat, and clearcoat — accounts for roughly one-third of the total vehicle manufacturing cost, and paint appearance is a major factor in purchasing decisions. Paint cratering can halt a production line. ToF-SIMS is the most effective technique for identifying the causes of paint cratering because the responsible agents are often tiny particles or ultrathin layers of low-surface-energy material, the detection of which requires both the surface sensitivity and chemical selectivity that only ToF-SIMS provides.
Based on a decade-long study of nearly 1,000 automotive paint craters, the distribution of responsible chemicals is illustrated below, followed by a table of their characteristic ions with nominal m/z values.
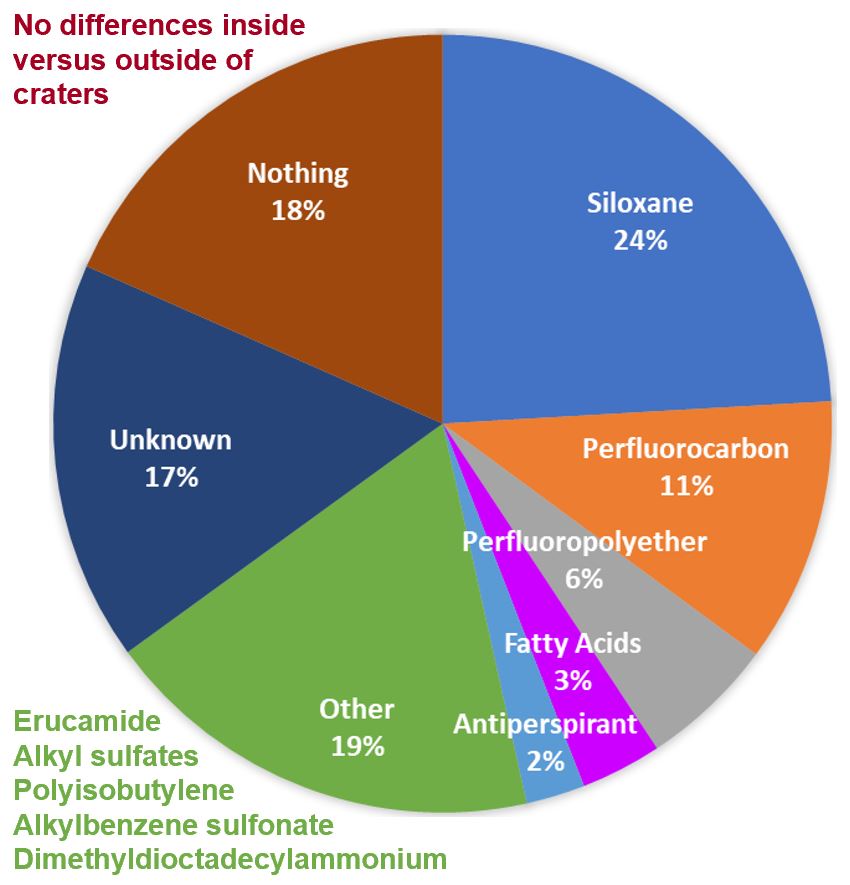
- Findings from the pie chart include
Antiperspirant (2%) – Likely originating from personal care products; the particels are usually coated with cyclic silicones.
Perfluorocarbons (11%) & Perfluoropolyethers (6%) – Found in lubricants and gaskets; these materials have extremely low surface energy.
Other Surfactants (21%) – Including fatty acids, alkyl sulfates, and erucamide, often from detergents or plastic additives.
Unknown (17%) – Some craters showed no identifiable residue, a result that is partly dependent on the analyst's experience.
Nothing Different Detected (18%) – Suggests that the responsible chemicals were either volatile or buried beneath the coating at the time of analysis.
| Chemical | Ion (nominal m/z) |
|---|---|
| Siloxane | Si+ (28), SiC3H9+ (73), Si2C5H15O+ (147), Si3C5H15O3+ (207), Si3C7H21O2+ (221), Si4C7H21O4+ (281), Si¯ (28), SiCH3O¯ (59), SiC2H5O¯ (73), SiCH3O2¯ (75), SiC3H9O¯ (89), SiC2H7O2¯ (91), Si2C3H9O3¯ (149), Si2C5H15O2¯ (163), Si2C4H13O3¯ (165), Si3C5H15O4¯ (223), Si3C7H21O3¯ (237) |
| Perfluorocarbons | C+ (12), CF+ (31), CF3+ (69), C3F3+ (93), C2F4+ (100), C2F5+ (119), C3F5+ (131), F¯ (19), CF3¯ (69) |
| Perfluoropolyethers | C+ (12), CF+ (31), COF+ (47), CF3+ (69), C2OF3+ (97), C3OF5+ (147), F¯ (19), COF¯ (47), CF3¯ (69), COF3¯ (85), C2OF5¯ (135), C3O2F5¯ (163), C3OF7¯ (185) |
| Fatty acids | Caprylate C8H15O2¯ (143), Caprate C10H19O2¯ (171), Laurate C12H23O2¯ (199), Myristate C14H27O2¯ (227), Palmitoleate C16H29O2¯ (253), Palmitate C16H31O2¯ (255), Linoleate C18H31O2¯ (279), Oleate C18H33O2¯ (281), Stearate C18H35O2¯ (283) |
| Antiperspirant | This is identified by ions from cyclic siloxanes, similar to those listed in Siloxane, along with metallic element analysis via scanning electron microscopy with energy dispersive X-ray spectroscopy, as the particles are often wrapped by siloxanes. |
| Polyisobutylene | With C4H8+ (56) and C7H13+ (97) being much more abundant than other hydrocarbons compared to adjacent hydrocarbon ions CxHy+. |
| Alkyl sulfates | SO3¯ (80), SO4H¯ (97), C12H25SO4¯ (265), C14H29SO4¯ (293) |
| Alkylbenzene sulfonate | SO3¯ (80), C8H7SO3¯ (183), C16H25SO3¯ (297), C17H27SO3¯ (311), C18H29SO3¯ (325), C19H31SO3¯ (339) |
| Erucamide | C3H6NO+ (72), C22H44NO+ (338), CN¯ (26), CNO¯ (42), C22H42NO¯ (336) |
| Dimethyldioctade-cylammonium | C3H8N+ (58), C20H44N+ (298), C23H76N+ (523), C38H81N+ (551) |
Differentiating fatty acids and their salts
Shown here is a composite image mapping Si+ (blue), C16H33O2+ (green) and C16H33O2Na2+
(red). 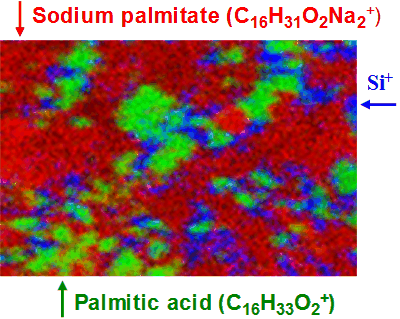
This image demonstrates the excellent chemical selectivity of ToF-SIMS: it differentiates palmitic acid from its salt (sodium palmitate) in a single measurement. In the salt-containing regions, almost no C16H33O2+ is detected. Both the acid and its salt, however, yield the abundant negative ion C16H31O2− (not shown), so the selectivity for this acid/salt pair lies entirely in the positive ion channel. This observation can be understood by considering the ion formation process: a fatty acid molecule needs to acquire only one proton to form a protonated molecular ion, whereas the corresponding sodium salt must acquire two protons — a process hindered by the presence of the Na+ cation. Instead, the salt more readily acquires one additional cation to form the doubly sodiated species C16H33O2Na2+. This differentiation between fatty acid and fatty acid salt applies generally across the homologous series.
Phase separation
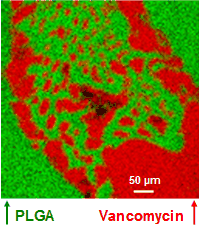
Phase separation of the antibiotic vancomycin and its polymeric matrix poly(lactide-co-glycolide) (PLGA) was observed when dimethyl sulfoxide (DMSO) was used as the casting solvent. The sample was prepared by depositing the solution onto a cleaved mica substrate. Phase separation is evident in the ion images of C7H4O2Cl− at m/z 155 (representing vancomycin) and C6H7O5− (representing PLGA). For vancomycin, C7H4O2Cl− — together with its isotope ion C7H4O237Cl− (not shown) — is a diagnostic ion that is both abundant and structurally specific to the molecule. Sulfur-containing species were additionally found co-localised with the vancomycin phase, suggesting a possible interaction between vancomycin and residual DMSO solvent.
Depth profiling
Metal oxides
Assisted by a sputter ion beam, ToF-SIMS can depth profile both inorganic and organic materials. In practice, a defined area is sputtered for a predetermined period to remove a thin layer of material, after which the newly exposed surface within the sputtered zone is analysed — providing one data point in the depth profile. This sputter/analysis cycle is repeated until the desired depth has been profiled. In most cases, the depth of the resulting crater is measured using a mechanical stylus or an optical profilometer to convert sputter time into depth. Sub-nanometre depth resolutions are readily achievable. Shown below are an optical image (top left) of the crater after depth profiling and depth profiles (right) of a layered structure of ZnO/In2O3/Si, using a 3 keV Cs+ sputter beam and a 25 keV Bi3+ analysis beam. The zinc oxide layer is tracked by ZnO−, the indium oxide layer by InO−, and silicon by Si−. Also shown is a cross-sectional image reconstructed from the profiled data, with the vertical dimension representing depth and the lateral dimension representing the scanned area.
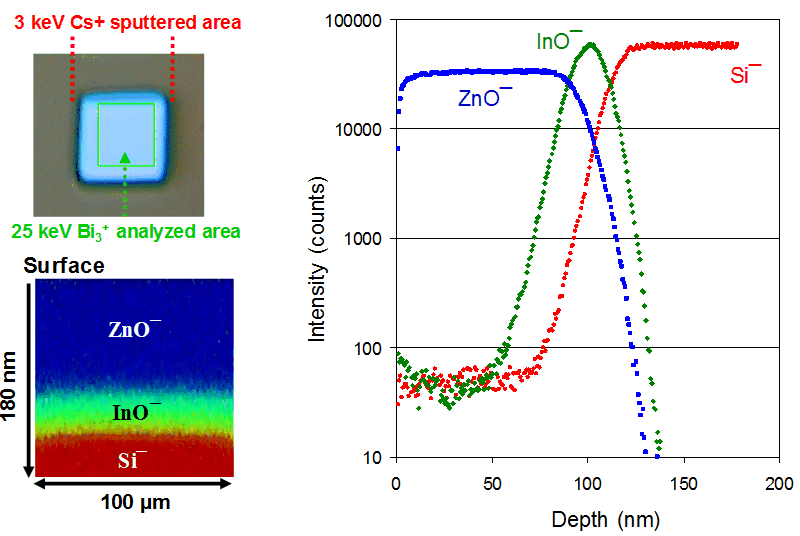
- dual-beam approach (sputter + analysis) for depth profiling
- sub-nanometre depth resolutions readily achievable
- powerful for investigating deposited thin films and native oxide layers
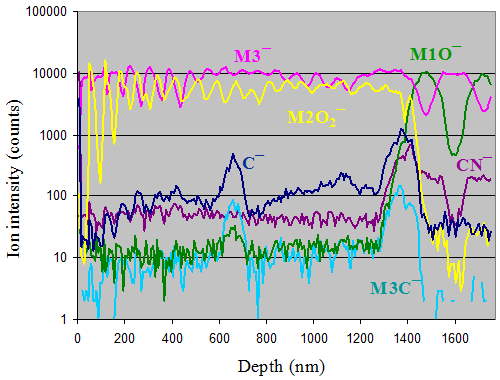
Shown above are depth profiles for a structure consisting of alternating layers of different oxides of metals M1, M2, and M3. Carbon and carbon-related ions are also displayed. A carbon peak is observed at mid-film, indicating elevated carbon levels associated with an interruption during the deposition process — attributed to hydrocarbon accumulation in vacuum during the interruption. This example demonstrates how ToF-SIMS depth profiling is powerful for assessing the quality and integrity of multi-layer structures, including the detection of buried contamination layers not apparent from surface analysis alone.
Layered organics
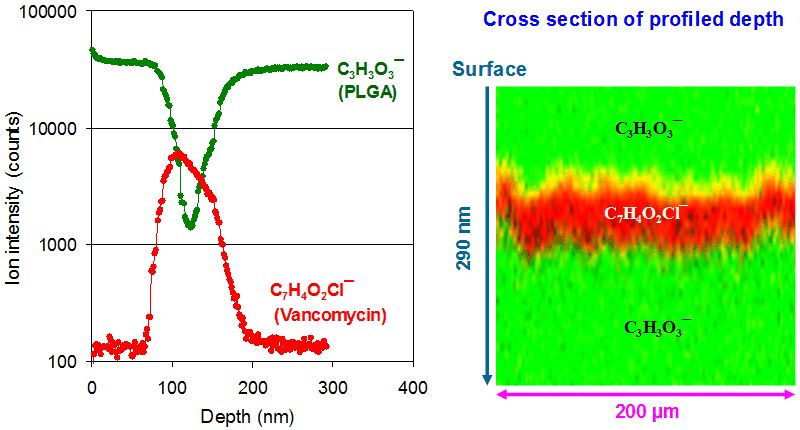
Depth profiling of organic materials often requires a sputter ion beam that does not significantly degrade the molecules of interest. C60+ is an effective sputter beam for many organic materials. Vancomycin is used here to showcase the ability of ToF-SIMS to perform three-dimensional molecular imaging. Shown below are depth profiles of C7H4O2Cl− and C3H3O3−, representing vancomycin and PLGA, respectively. The ion intensities for each depth slice represent the sum over the entire scanned area. Since each pixel carries a full mass spectrum at every probed depth, ToF-SIMS provides a fully three-dimensional distribution of chemical information. Shown on the right-hand side of the figure is a cross-sectional image (an x–z plane cut through the profiled volume), with the vertical direction representing depth (z = 290 nm) and the lateral direction representing the scan width (x = 200 μm).
Quantifying cross-linking degrees of PMMA
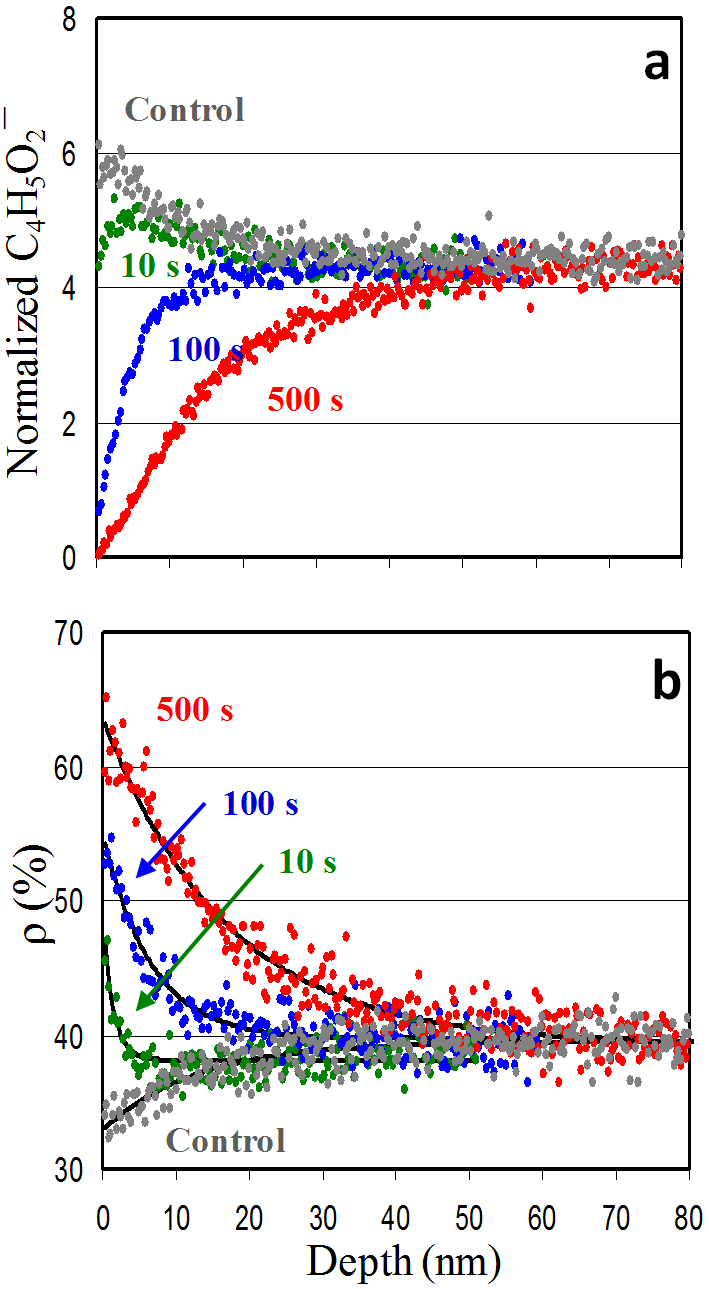
An approach based on ToF-SIMS was developed to determine the degree of cross-linking at the surface and its variation with depth in organic thin films. Poly(methyl methacrylate) (PMMA) films spin-coated on Si substrates were cross-linked using a surface-sensitive hyperthermal hydrogen projectile bombardment technique. The ion intensity ratio between two ubiquitous hydrocarbon species, C6H− and C4H− — denoted ρ — was used as an index of cross-linking degree, and its depth dependence was profiled using a C60+ sputter beam.
The control PMMA film exhibited ρ = 32% at the surface with a 25 keV Bi3+ primary beam. After hyperthermal hydrogen projectile bombardment for 10, 100, and 500 seconds, ρ increased to 45%, 56%, and 65%, respectively. Depth profiles of ρ showed an exponential decay from the surface, from which cross-linking depths of approximately 3, 15, and 39 nm were estimated for the three treated films.
As shown in panel (a) of the figure, the characteristic PMMA fragment ion C4H5O2− tracks the degree of cross-linking. Panel (b) demonstrates that the ion intensity ratio ρ = C6H−/C4H− provides a unique and practical means of assessing the surface cross-linking degree of PMMA films, with the capability to resolve cross-linking gradients at the nanometre scale using C60+ depth profiling.
- ToF-SIMS depth profiling enables quantitative assessment of cross-linking degree as a function of depth
- sub-nanometre depth resolution with C60+ sputter beam
- opportunities to develop novel analytical approaches for characterising organic thin films
Principal component analysis of CnH¯ ions
The chemical information content of ToF‑SIMS ion mass spectra lies in hundreds of fragment ions, whose intensities together encode surface composition. While this richness enables detailed chemical identification and exploration of surface chemistry, it also presents a significant data‑analysis challenge. Dimensionality‑reduction techniques such as principal component analysis (PCA) have therefore proven very useful for extracting meaningful patterns from complex ToF-SIMS datasets.
In PCA, the original variables (here, ion intensities) are linearly transformed into a set of new orthogonal variables called principal components (PCs). Each PC is a linear combination of the original variables and is constructed such that the first PC captures the maximum possible variance in the data, followed by successive PCs capturing decreasing portions of the remaining variance. Although the total number of PCs equals the number of original variables, the first few PCs typically account for most of the meaningful variance, allowing effective dimensionality reduction. It is important to note that PCA is a purely mathematical transformation; physical or chemical interpretation of the PCs must be guided by knowledge of the system under study.
By projecting ToF‑SIMS data onto the first two or three PCs, complex high‑dimensional datasets can often be visualized in a reduced‑dimension space. Score plots reveal similarities and differences among samples or regions, while loading plots identify which ion fragments contribute most strongly to the observed variance. When combined in a biplot, scores and loadings together provide an intuitive framework for interpreting correlations between samples and chemical species. In this way, PCA serves as a powerful exploratory tool that complements ion images and spectra, enabling clearer interpretation of surface chemical heterogeneity in ToF‑SIMS analysis.
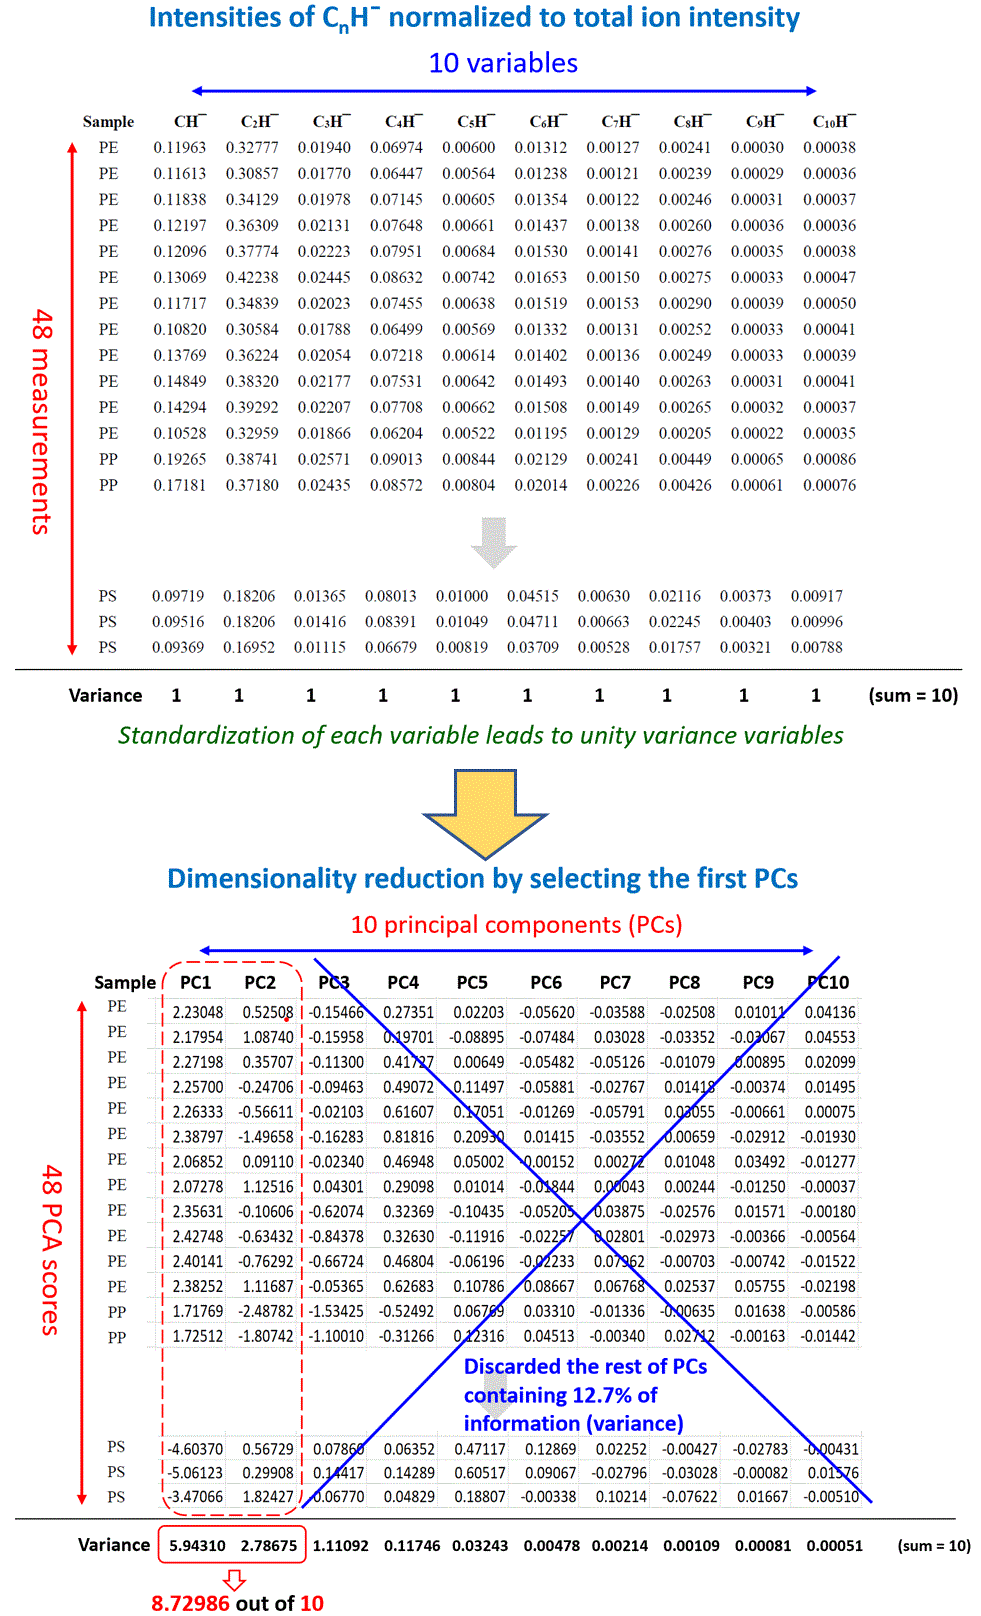
Shown below is an example illustrating how PCA provides insight into ToF‑SIMS data acquired from hydrocarbon ion species measured on polymers. The ion intensities are normalized to the total ion intensity and then standardized so that each ion has a unit variance, resulting in a dataset with a total variance of 10. The PCA results show that the first and second PCs explain variances of 5.94310 and 2.78675, respectively. Together, these two components account for 87.3% of the total variance, allowing the remaining eight PCs to be discarded at the cost of only 12.7% information loss. This example clearly demonstrates how PCA achieves effective dimensionality reduction while retaining the dominant chemical information in the dataset.
- PCA enables visualisation of clustering (or lack thereof) among observations through the first two or three PCs
- loading vectors reveal which ions contribute most to the observed clustering
- variable vectors in a biplot show correlations between ion intensities across samples
PCA results can be visualised simultaneously for observations and variables in a biplot. A biplot overlays the PCA scores of observations (plotted as points) with the loading vectors of variables (plotted as arrowed lines), both on the same pair of PCs — typically PC1 and PC2. This PCA and biplot approach allows simultaneous visualisation of similarities and differences among observations, their relationships with the measured variables, and correlations among the variables themselves.
Shown in the biplot below is a covariance biplot for polyethylene (PE), polypropylene (PP), polyisoprene (PIP), polystyrene (PS), and poly(methyl methacrylate) (PMMA) at different cross-linking degrees. The PCA was performed on a dataset of 10 CnH− ions (n = 1 to 10) using the prcomp() function in the open-source R language, which is based on singular value decomposition (svd() in R) and returns scores, loadings, and eigenvalues (i.e., PC variances).
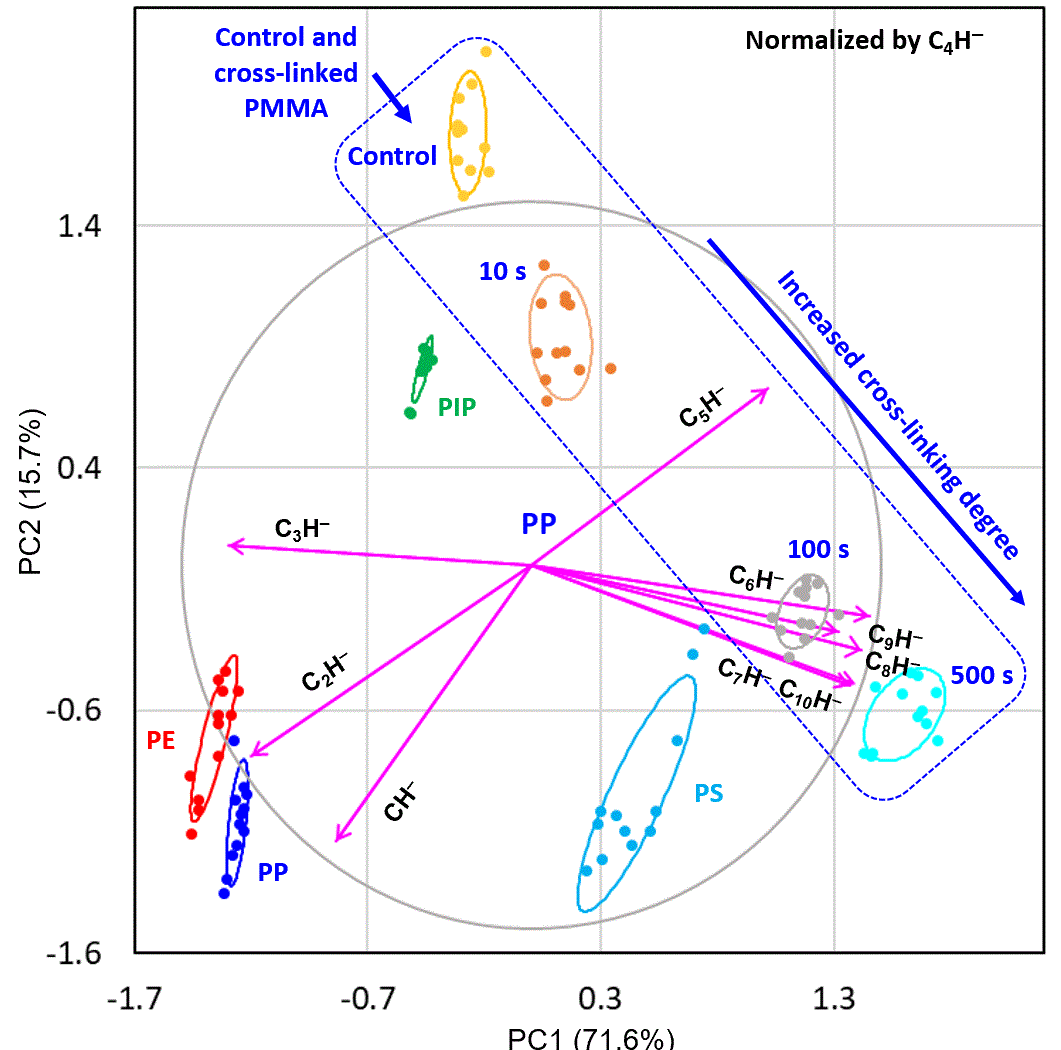
The score of an observation on a PC is the projection of all CnH− intensities onto the PC axis — representing the observation as a single point in PC space. A score plot reveals clustering and separation among samples. The loading plot shows the contributions of individual CnH− ions to the PCs. An arrowed line (variable vector) in the biplot points in the direction of increasing ion intensity in PC coordinates; the angle between two variable vectors indicates their correlation: near 0° means positively correlated, near 180° means negatively correlated, and near 90° means uncorrelated.
The loading plot clearly shows that C6H− through C10H− cluster together with large loadings on PC1, indicating that these larger ions co-vary strongly. By contrast, C2H− and C3H− point in approximately the opposite direction, with increased loadings on PC2. When the intensities of the larger CnH− ions increase, those of the smaller ones decrease, and vice versa.
- PC1 captures the variability in "carbon density" across the five polymer types
- polymers with higher carbon density favour the formation of larger CnH− ions (C6H− to C10H−); those with lower carbon density produce smaller fragments (C2H−, C3H−)
- C4H− intensity shows relatively little variability across polymer types
Assisted by PCA, it was confirmed that it is the "carbon density" of a polymer — rather than its specific molecular structure — that primarily governs the distribution of CnH− fragment intensities captured by PC1. The PCA framework thus provides a rational, data-driven basis for interpreting the rich ion intensity patterns observed in ToF-SIMS spectra of polymers.
