CS 2120: Topic 11
Videos for this week:
Getting started with Machine Learning (ML)
Learning to play Super Mario Bros:
Learning to scan for tumours:
Learning to understand speech:
What is ML?
The field of study pertaining to algorithms which learn and improve through “experience”
Today we’ll be using a toy dataset (i.e. a small dataset for showing an example) in order to go over (at a surface level) two types of ML:
supervised learningunsupervised learning.
We’ll consider one example of each (i.e. Support Vector Machines, k-Means clustering).
We’ll use
scikit-learnto implement these examples.
“scikit-learn”
Has many, many ML libraries: click here if you want to take a look
Supervised Learning
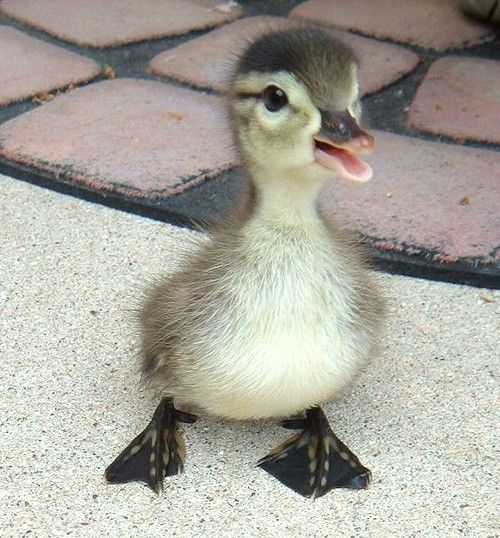
I show you photos of ducks or cats, and tell you that they’re either ducks or cats. Then, I show you new photos (of different ducks or cats) and ask you to tell me whether they’re ducks or cats.
Here’s a “duck”:
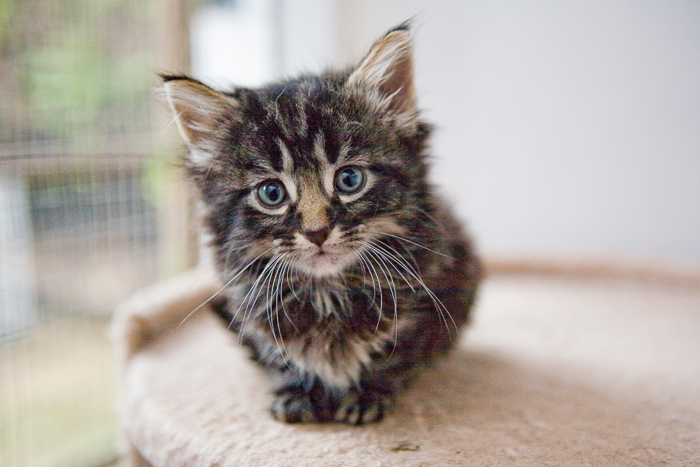
Here’s a “cat”:
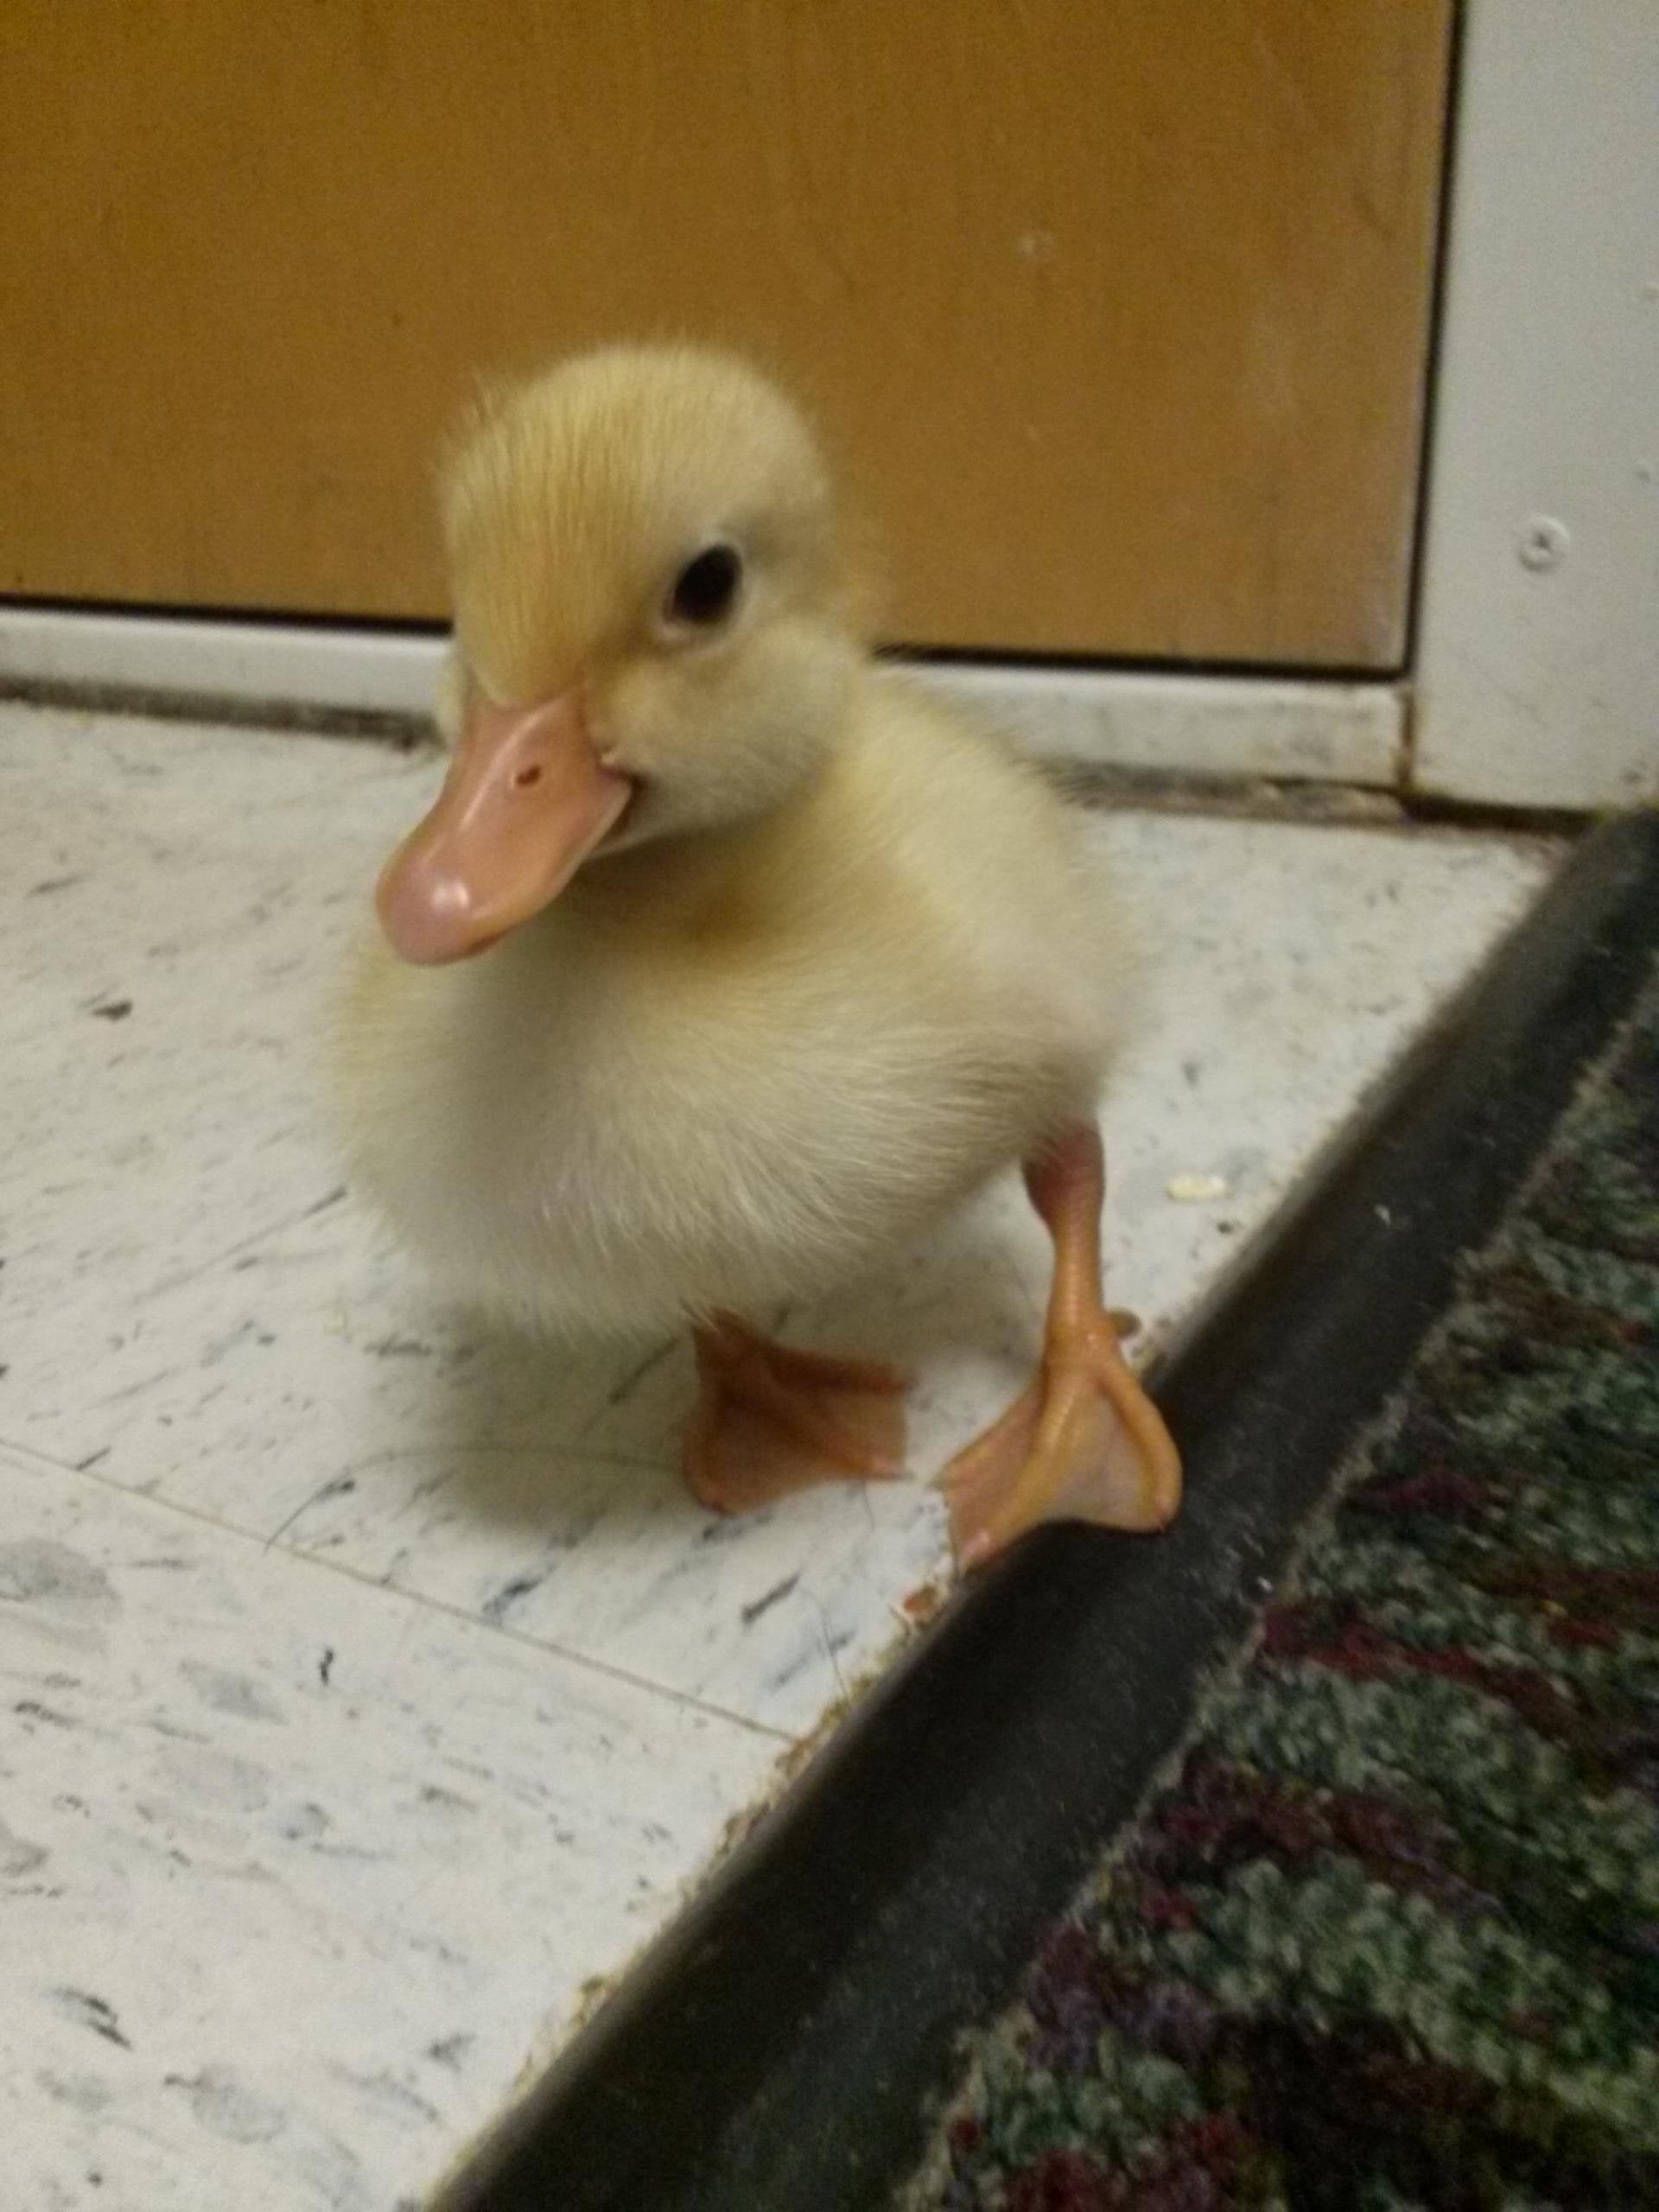
- What’s this?
One of the main methods for supervised learning is “classification”: putting data into various
classesbased on theirattributes. This is what we’ll focus on here.For classification, when you
trainyour system, you provide both theinput dataandoutput data(“class labels”); when youtestyour system, you provide only the input data and test whether your system can correctly predict the outputs.the goal: you want your system to be able to
generalizethe training data so that it canclassifynew (i.e. test) inputs
Let’s review some terminology
Consider this sample data (from our toy dataset).
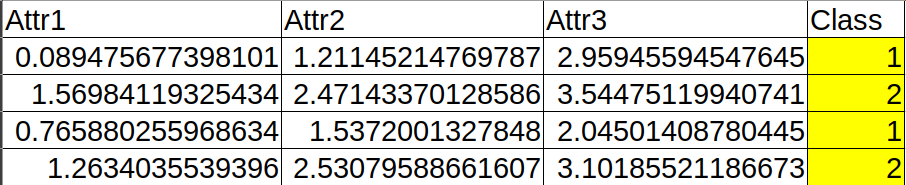
This data has 3 Attributes (Attr1, Attr2, Attr3) and 2 Class Labels (Class 1 or Class 2).
One sample is essentially one set of attributes. If it is labelled, then it includes the class, if it is unlabelled, then it does not include the class.
Here is one (labelled) sample:

If we trained our machine in a supervised way, we would provide it with each of these labelled samples. Note that in general we use most of our dataset for training.
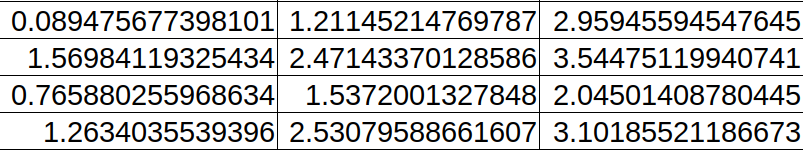
To feed in our inputs and labels, we could choose to have two arrays (or dataframes, or …) — call them input and output.
Here is what input could look like:
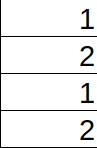
Here is what output could look like:
If we then tested our machine, we could provide it with new inputs (unlabelled) and test whether or not the machine correctly predicts the labels.

Since we know the corresponding labels (but our machine doesn’t), we can then check how many correct predictions there were for each class. We can then represent this using a confusion matrix. Below is an example of a confusion matrix:
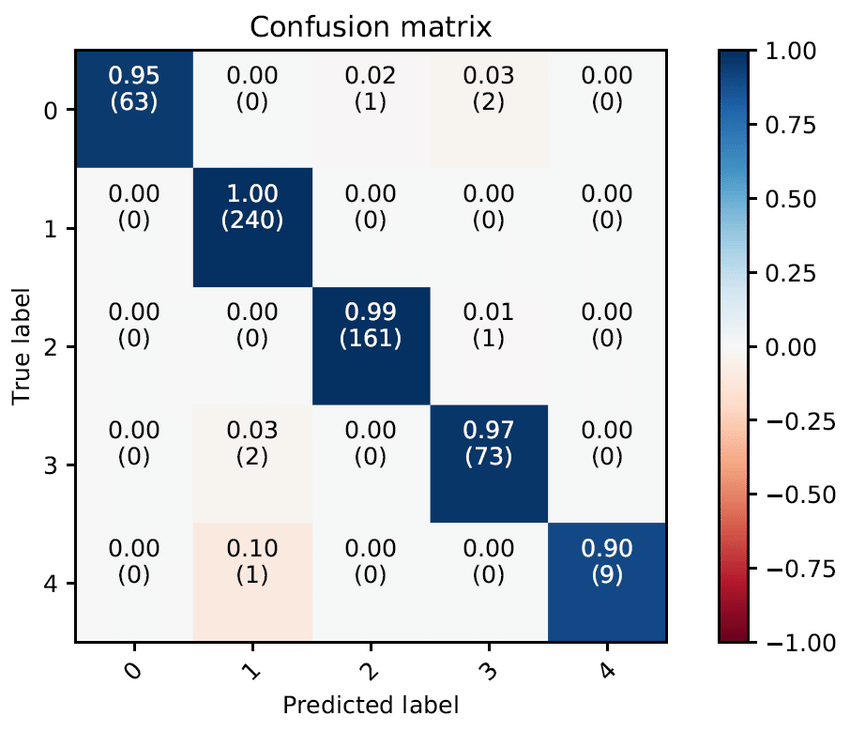
Note that in the confusion matrix above there are 5 classes. The entry at Row 3, Col 1 (i.e. ‘(2)’’) — for example — indicates that the machine predicted class 1 when the correct answer was class 3 a total of 2 times.
Supervised learning: Support Vector Machines (SVM)
The “basic” idea (in 2D, 2 classes):
draw a hyperplane (in 2D, this is a line) which
best separates the data from each class.the best hyperplane will maximize the distance between the hyperplane and the “support vectors” (see below)
Graphically (in 2D, 2 classes):
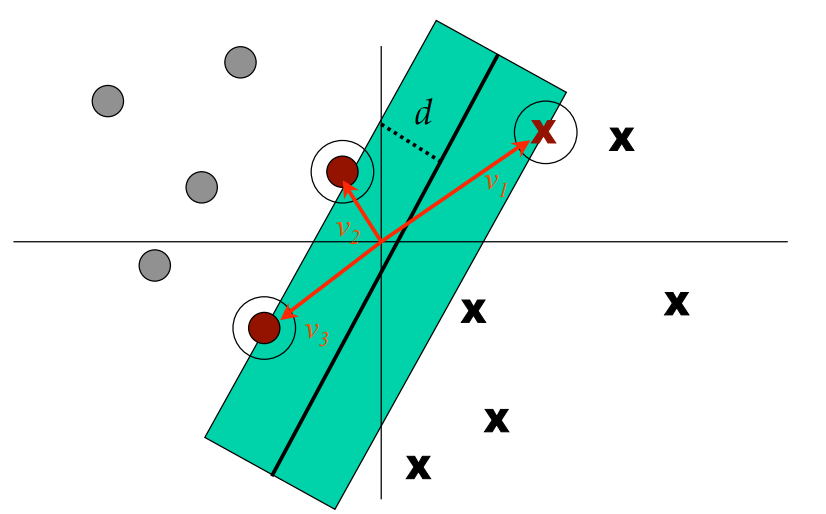
Looking at this graph…
We see 2 classes of data (grey dots, black x’s)
The support vectors are the 3 red arrows (v1, v2, v3) — these correspond to data points which are at the boundary of the margin; for SVMs we want to maximize this margin.
Side note: a soft margin allows for some mis-classifications in order to improve classification accuracy
Note that we want to be able to classify data with more than 2 attributes, so our vectors will be higher-dimensional
This is a lot harder to visualize, but it’s the same idea: separate the classes via ‘hyperplanes’. The idea is exactly the same: partition the space.
This idea leads to the Linear Support Vector Machine.
Do we have to code this from scratch?
No, with sklearn we can create and use one in 3 lines of code:
>>> from sklearn import svm
>>> svc = svm.SVC(kernel='linear')
>>> svc.fit(input,output)
Unsupervised learning
i.e. the “duck-cat” example again, but
without provided labels.One of the main methods for unsupervised learning is “clustering”. This is what we’ll focus on.
For clustering, given a bunch of unlabelled data (or you can ignore the labels), you want to see if any of
these itemslook like any ofthose other items. You want a program that will divide your dataset into clusters where all of the data items in the same cluster are similar to each other in some way.
Unsupervised learning: k-means clustering
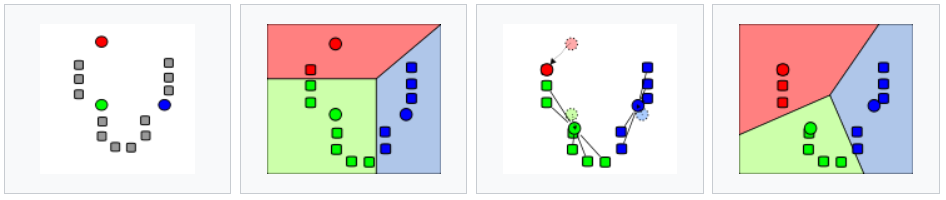
The idea:
Plot all of our datapoints.
Guess the number of clusters we’re looking for, i.e 3 (using the image above).
Randomly place 3 “means” on the plane.
- Repeat the following until convergence:
Associate each data point to the nearest “mean”.
Compute the centroid of all of the points attached to each “mean”.
Move the position of the “mean” to this centroid.
Let’s try it for our dataset (note we ignore
labels!):>>> from sklearn import cluster >>> k_means = cluster.KMeans(2) >>> k_means.fit(data)
For next class
If you want to get deeper into ML, Andrew Ng offers a ML course on Coursera.
Work on Assignment 4